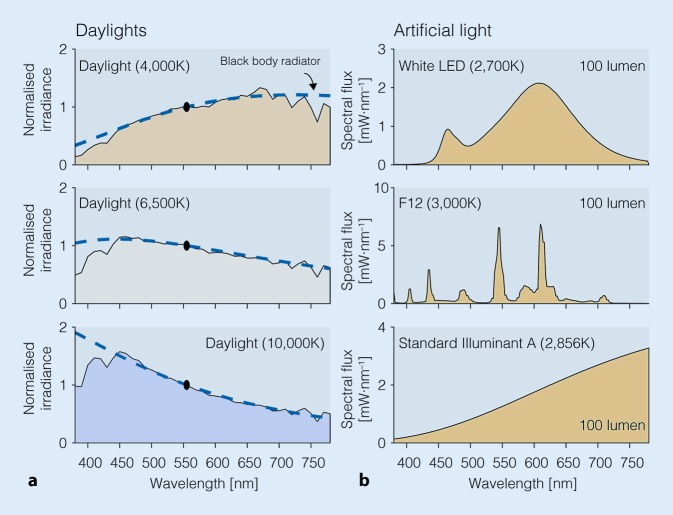
Fig. 2.
Spectral power distributions of common light sources in our environment. a Spectral power distributions of daylights at different correlated colour temperatures (CCT; 4000 K; 6500 K; 10,000 K). Spectra are normalised to 555 nm. b Spectral power distributions of a white LED (top), a fluorescent source at 3000 K (middle), and an incandescent source (tungsten-filament; 2856 K, bottom). All three artificial sources have the same luminous flux (normalised to 100 lm), and approximately the same colour temperature (2700–3000 K), but the spectra are very different in shape and scale (see y axis)

