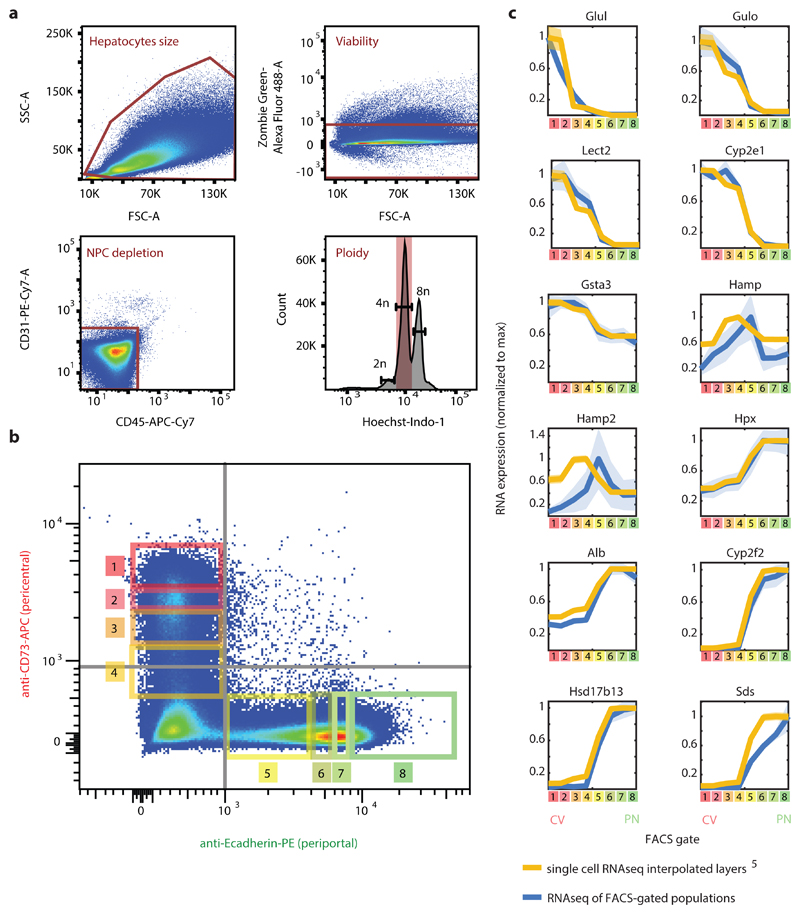
Fig. 3. Spatial sorting reliably captures the different lobule layers.
a, FACS gating strategy. FSC-A and SSC-A were used for hepatocytes size selection. Non-viable cells were filtered out by Zombie Green Viability kit. Staining with CD31 and CD45 antibodies enabled gating-out non-parenchymal cells. Tetraploid hepatocytes were selected based on Hoechst stain. b, Distribution of the included cells (40-60% from all events) according to intensities of CD73 and E-cadherin. Grey lines mark the unstained control limits, rectangles and numbers mark the gates used for spatially-sorted populations. Distributions from five independent mice were similar. c, Max-normalized expression patterns of selected genes along the different FACS gates in blue (N=5 mice), compared with interpolated max-normalized zonation profiles based on 5 in yellow. Lines are the mean of each FACS gate for the 5 mice (blue) and mean of each interpolated layer for the 1415 cell from 3 mice (yellow). Line patches represent SEM.

