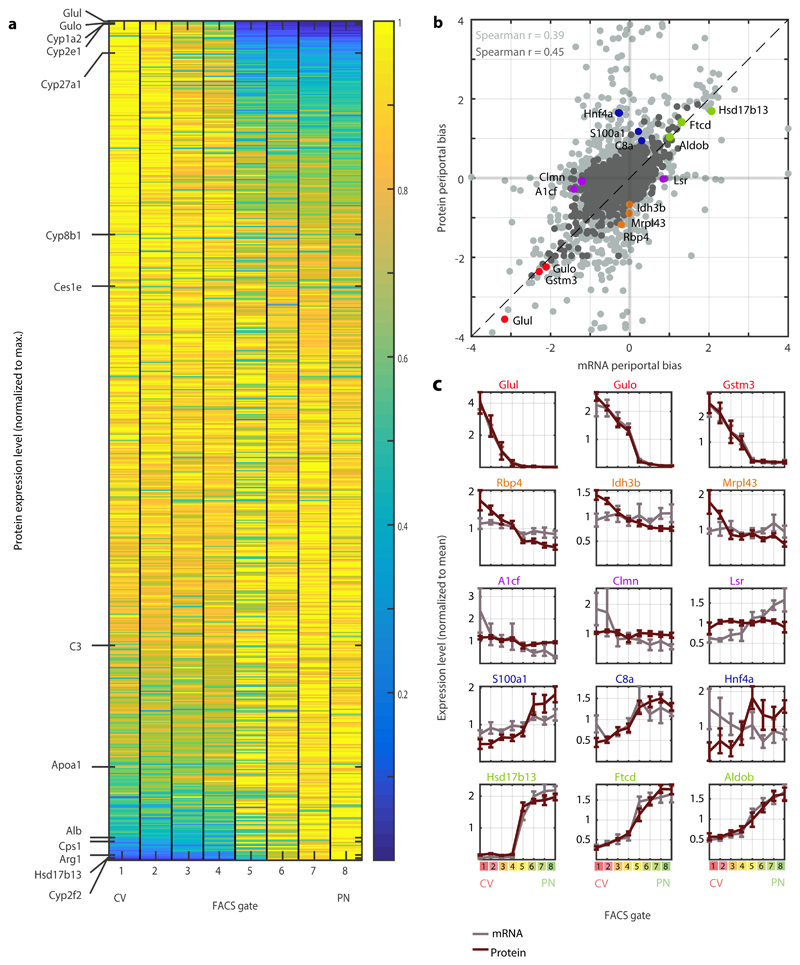
Fig. 5. A spatial atlas of the hepatocyte proteome.
a, Zonation of hepatocyte proteins. Genes are sorted by the zonation profile center of mass. Representative liver proteins are shown on the left, to demonstrate the zonation profiles visualization. Protein levels were normalized to the maximal level across all FACS gates. b, Periportal bias in expression of mRNA and proteins, calculated as the difference between the two periportal gates and the two pericentral gates, normalized by the mean expression across all gates. Light grey – all matched mRNA and proteins (n=3,051). Dark grey – mRNA and proteins with minimal expression fraction higher than 10-5 in any of the gates for both mRNA and protein (n=1,565). Spearman’s r is indicated for each dataset. Dashed line marks a slope of 1. N=5 mice c, Expression profiles of mRNA (grey) and their respective proteins (red). Mean of five mice is plotted. Error bars represent SEM.

