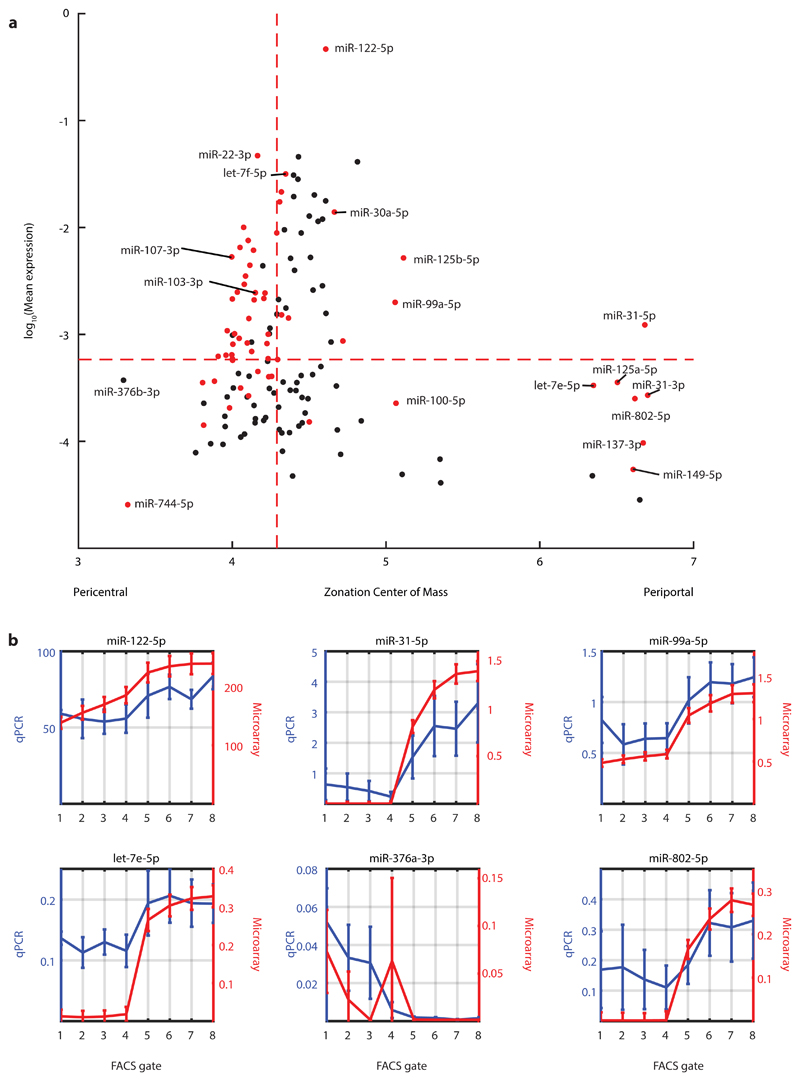
Fig. 6. Zonated expression of hepatocyte miRNAs.
a, Mean expression vs. zonation profile center of mass for all detected high-confidence miRNAs. Selected miRNAs are labelled. Dashed red lines denote the median of each quantity. Red dots are miRNAs that are significantly zonated (two sided Kruskal-Wallis test with following Benjamini-Hochberg FDR ≤ 0.2). N=3 mice. b, Validations of hepatocyte miRNA zonation profiles using qRT-PCR. Profiles for both qRT-PCR and microarrays are normalized by expression levels of miR-103-3p (Spearman’s r = 0.70±0.24). Lines indicate layer mean over 3 microarry mouse-repeats (red) and layer mean over 3 qPCR mouse-repeats (blur). Error bars indicate SEM. Discrepancies between qRT-PCR and microarray profiles for let-7e-5p, miR-376a and miR-802-5p may be due to limited sensitivity of the microarray at low expression levels. N=3 mice for microarray and for qPCR.

