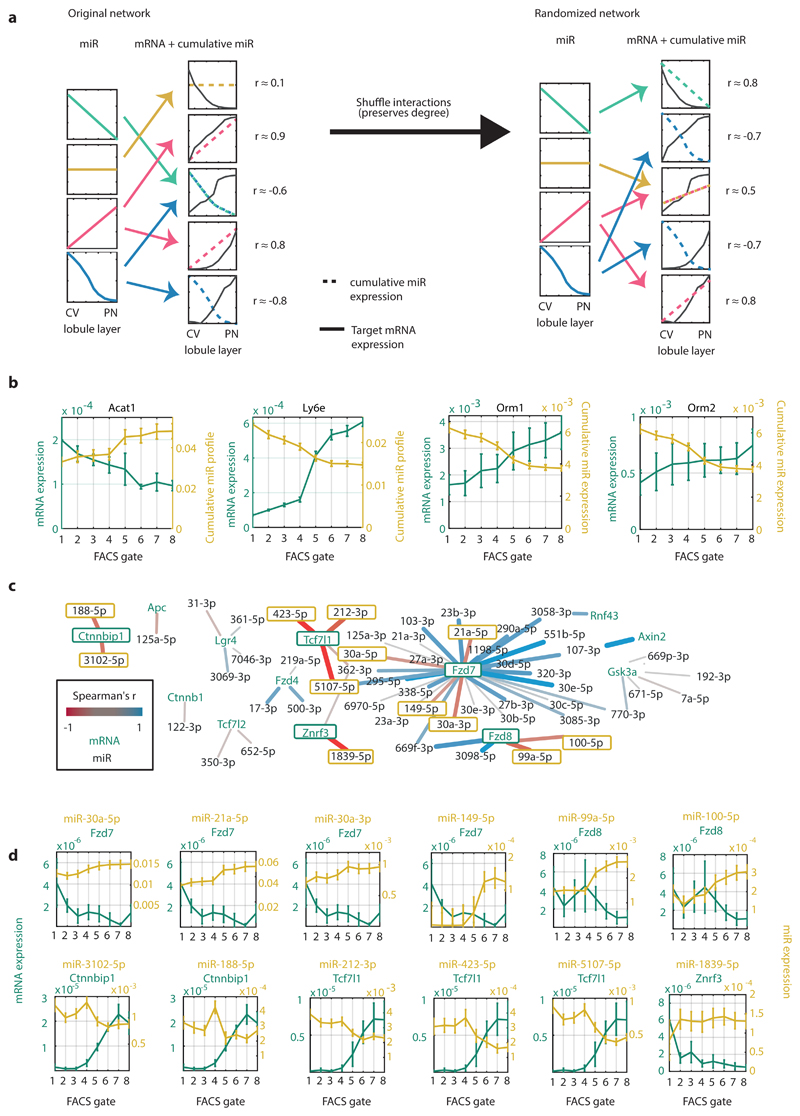
Fig. 7. Network analysis of miRNA-target interactions.
a, Schematic illustration of the algorithm for inferring significant interactions between miRNAs and target genes. b, Zonation profiles of selected genes and their significantly anti-correlated cumulative miRNA profiles. Lines represent mean of 5 mice for mRNA (green) and 3 mice for miRNA (yellow). Error bars are SEM. c, Regulatory network of hepatocyte-expressed Wnt pathway components and their expressed regulating miRNAs. Edges colored by the correlation between the miRNA and target. Edge weight is proportional to the absolute correlation value. N=3 mice for miRNA dataset, 5 mice for mRNA set. d, Selected pairs of miRNAs and regulated Wnt signaling components (outlined in green in Fig. 7c). The transcripts of Ctnnbip1, Fzd8, Tcf7l1 and Znrf3 are anti-correlated with most of their regulating miRs, suggesting that miRNAs have a relatively more important role in regulating these genes’ expression in comparison to other genes. Lines represent mean of 5 mice for mRNA (green) and 3 mice for miRNA (yellow). Error bars are SEM.

