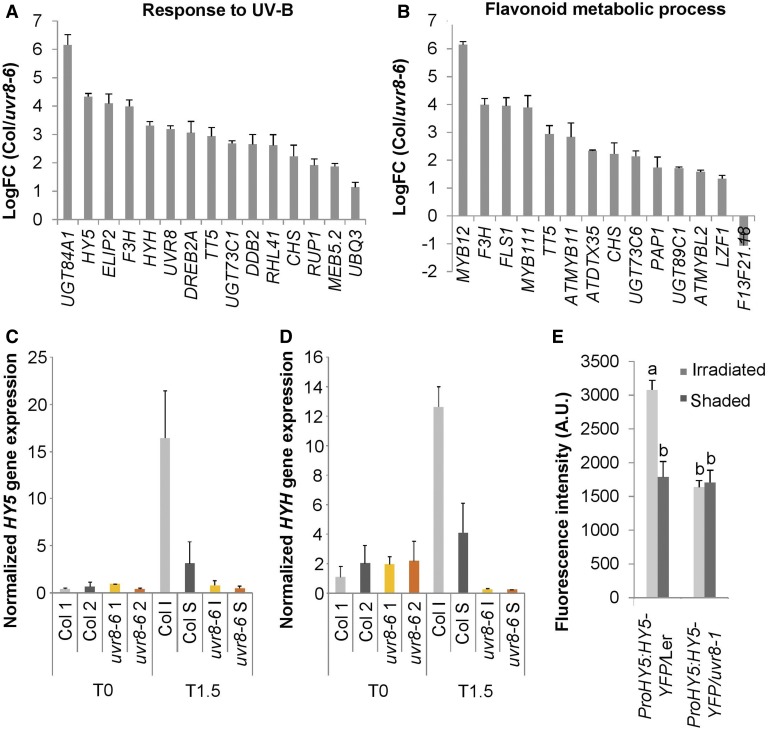
Figure 3.
Spatial Expression Differences in Arabidopsis Inflorescence Stems Exposed to Unilateral UV-B.
(A) and (B) Gene expression analysis by RNA-seq of the bending zone after 1.5 h of 1.3 µmol m−2 s−1 311 nm unilateral UV-B treatment of Col and uvr8-6 stems. UVR8-regulated genes were selected. Genes with a logFC value higher than 1 and/or lower than −1 with a p-value < 0.05 were selected for GO analysis. The logFC values of the overrepresented genes of the response to UV-B category (A) and the flavonoid metabolic process (B) are shown. With positive values, induced and negative values repressed in Col, compared with uvr8-6. Error bars indicate se (n = 3).
(C) and (D) HY5 (C) and HYH (D) expression in inflorescence stems exposed to 1.3 µmol m−2 s−1 of unilateral irradiation (UV-B treatment) for 1.5 h (T1.5), or nonexposed inflorescence stems (T0) was determined by RT-qPCR. The irradiated side (I) was dissected from the shaded side (S). Nonexposed plants were dissected longitudinally in two halves without specific positioning (1 and 2), both for the wild type (Col) and uvr8-6 mutants. Error bars indicate se (n = 3).
(E) Quantification of fluorescent HY5-YFP signal in the inflorescence stem cortex of the wild-type (Ler) or uvr8-1 plants expressing the ProHY5:HY5-YFP transgene after 3 h of unilateral 1.3 µmol m−2 s−1 UV-B treatment. Error bars are se (n ≥ 6). The superscript lowercase letters (a, b) indicate statistically significant difference in YFP intensities across the inflorescence stems at the 0.05 level (p-value ≤ 0.003) based on independent samples Kruskal–Wallis test. A.U., arbitrary units.

