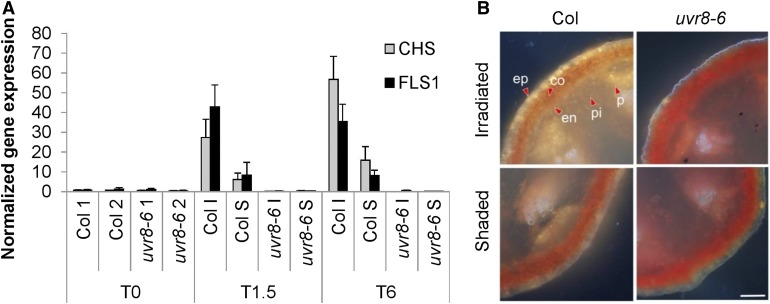
Figure 5.
Asymmetric Accumulation of Transcripts Encoding Flavonoid Biosynthesis Enzymes and Flavonols.
(A) RT-qPCR analysis of CHS and FLS1 gene expression in stems irradiated with unilateral 1.3 µmol m−2 s−1 of 311 nm UV-B light for 1.5 h (T1.5) or 6 h (T6) or without UV-B exposure (T0). Irradiated side (I) was dissected from the shaded side (S); stems of nonexposed plants were dissected without orientation in two halves (1 and 2), both for the wild type (Col) and uvr8-6 mutants. Error bars are se (n = 3).
(B) Comparison of flavonol content of the irradiated side versus the shaded side of Arabidopsis inflorescence stems after UV-B treatment for 12 h. Transverse sections were made and mounted in DPBA and were documented by epifluorescence microscopy. The quercetin derivatives are visible as yellow/orange; red shows autofluorescence. Arrowheads indicate chosen cells in the epidermis (ep), cortex (co), endodermis (en), phloem (P), and pith (pi). Bar = 100 µm.

