Figure 7.
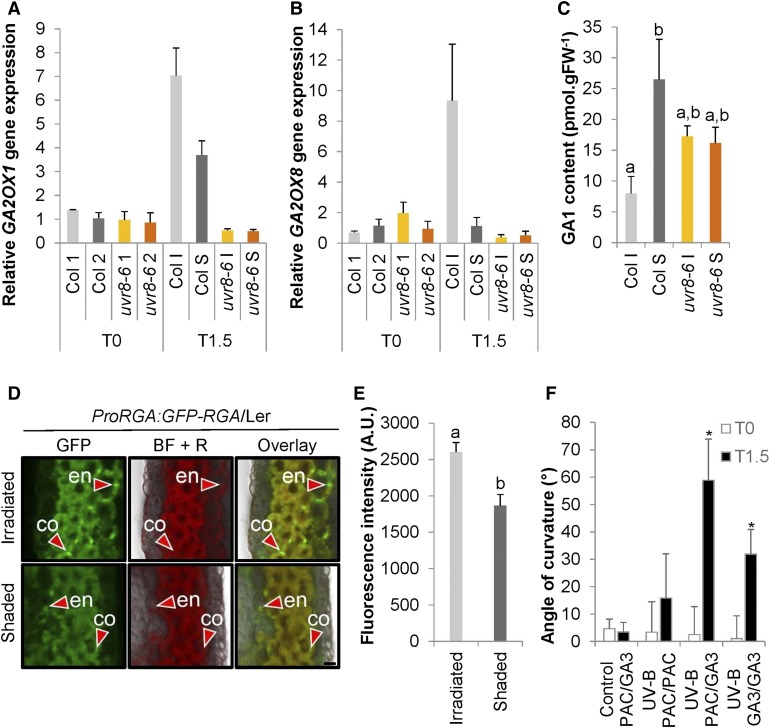
Differential GA Signal Is Involved in UV-B–Induced Phototropic Responses.
(A) and (B) GA2OX1 (A) and GA2OX8 (B) expression was determined in stems that were exposed to 1.3 µmol m−2 s−1 of unilateral UV-B irradiation for 1.5 h (T1.5) or nonexposed (T0). The irradiated side (I) was dissected from the shaded side (S), and nonexposed plants were dissected longitudinally without specific direction in two halves (1 and 2), both for the wild type (Col) and uvr8-6 mutants. Error bars are se (n = 3).
(C) GA1 content measured in stems after 3 h of UV-B treatment as described in (A) and (B). Error bars are se (n = 4). The superscript lowercase letters (a, b) indicate statistically significant difference in the GA1 content at the 0.1 level (p-value = 0.084) based on an independent samples Kruskal–Wallis test.
(D) Transverse section of stems from pRGA:GFP-RGA/Ler plants after 4 h of UV-B treatment was examined using CLSM. A few representative nuclei containing GFP-RGA are marked with red arrowheads in the cortex (co) and endodermis (en); the GFP channel, bright-field + red channel for autofluorescence (BF + R), and the overlay are displayed from both the irradiated and shaded side. Bar = 10 µm.
(E) Quantification of the RGA-GFP signal obtained by CLSM in the stem endodermis of pRGA:RGA-GFP/Ler plants irradiated by unilateral UV-B. Error bars indicate se (n = 12). The superscript lowercase letters (a, b) indicate statistically significant difference in GFP intensities across the inflorescence stems at the 0.05 level (p-value = 0.001) based on an independent samples Mann–Whitney U test. A.U., arbitrary units.
(F) Angle of curvature of the wild-type (Col) inflorescence stems with a split stem base that had PAC or GA treatment on either side and were subsequently irradiated with unilateral UV-B (UV-B) or kept in white light (control). The measurement of stem curvature was done at the beginning (T0) and after 1.5 h of irradiation (T1.5). Error bars indicate se (n ≥ 7). The asterisks indicate statistically significant difference in the angle of curvature of inflorescence stems at T1.5 versus T0 at the 0.05 level (p-value < 0.001) based on a Mann–Whitney U test.

