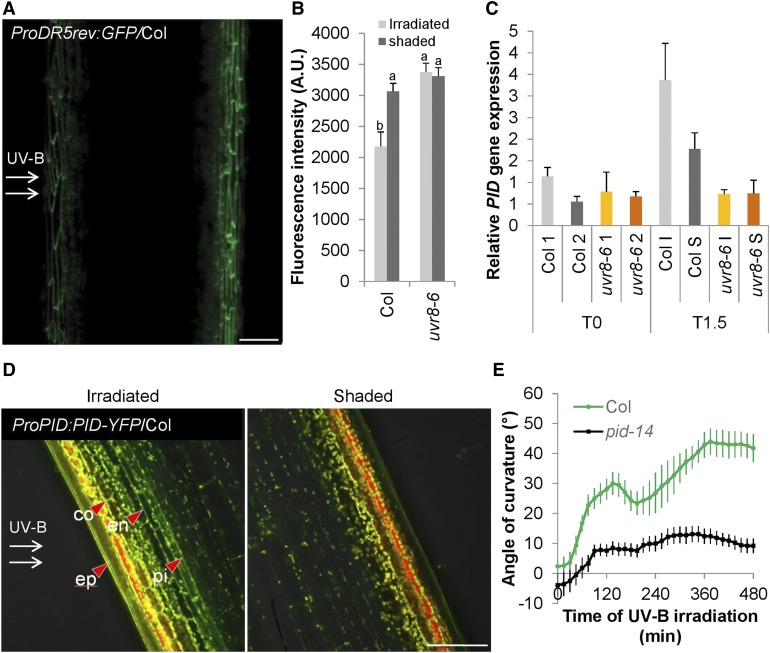
Figure 8.
Auxin Gradient Is Established for UV-B–Induced Phototropic Responses.
(A) CLSM image of expressing ProDR5rev:GFP/Col after 4 h of unilateral 1.3 µmol m−2 s−1 UV-B (UV-B treatment). Green color indicates GFP. Bar = 100 µm.
(B) Quantification of ProDR5rev:3xVenus-N7 in the epidermis after 4 h of UV-B treatment based on CLSM. Error bars indicate se (n ≥ 9). The superscript lowercase letters (a, b) indicate statistically significant difference in Venus-N7-intensities across the inflorescence stems at the 0.1 level (p-value = 0.002) based on independent samples Kruskal–Wallis test. A.U., arbitrary units.
(C) RT-qPCR experiment of the PID gene expression in stems that were exposed to unilateral UV-B treatment for 1.5 h (T1.5) or nonexposed (T0). The irradiated side (I) was dissected from the shaded side (S), and nonexposed plants were dissected longitudinally without specific direction in two halves (1 and 2), both for the wild type (Col) and uvr8-6 mutants. Error bars are se (n = 3).
(D) CLSM image of ProPID:PID-YFP/Col after 4 h of unilateral UV-B treatment expressed in Col stem. YFP signal is observed in the membranes of the epidermis (ep), cortex (co), endodermis (en), and pith (pi). Green color indicates the YFP signal; yellow and red show autofluorescence. Bar = 100 µm.
(E) Kinetic analysis of the bending response of the UV-B–treated wild-type (Col) and pid-14 mutant inflorescence stems. Stem orientation was quantified over time. Error bars indicate se (n ≥ 12).

