Figure 4.
RRC1 Controls Pre-mRNA Splicing of a Large Number of Genes in Arabidopsis.
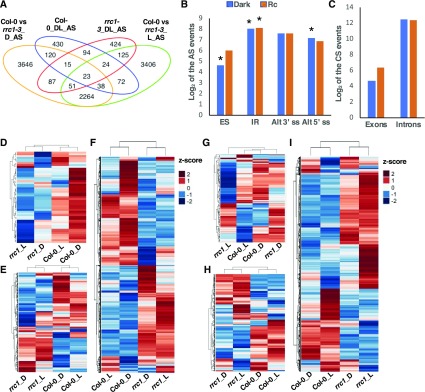
(A) Venn diagram shows the number and overlap of the differentially splicing events (FDR < 0.05 and absolute value of Delta_PSI/PIR > 3%) in Col-0 and rrc1-3 mutant grown in the dark and light-treated samples. AS, differentially splicing events; D, dark condition; L, light condition.
(B) and (C) Bar graphs show the categories of the differentially spliced events in rrc1-3 compared with Col-0 wild type under dark (blue) and light (orange) conditions, respectively. (B) AS: ES, IR, Alt3ʹss, and Alt5ʹss. (C) CS events: exon or intron events. The asterisks indicate that differentially splicing events were significantly enriched in that category in the rrc1-3 mutant background.
(D) to (I) Heatmaps of pre-mRNA splicing profiles, based on Z-scores of PSI/PIR values of Col-0 and rrc1-3 in the dark (see [D] to [F]) and light conditions (see [G] to [I]). The Z-scores of PSI/PIR values for the corresponding events under light and dark have been added for comparison purpose only in the dark and light heatmaps. Hierarchical clustering was performed on genes with altered pre-mRNA splicing pattern between Col-0 and rrc1-3. Blue color indicates low Z-scores, whereas red color indicates high Z-scores. Red light intensity used was at 7 μmol m−2 s−1.
(D) and (G) Heatmaps of the quantified splicing profiles of ES events and CS exon changes.
(E) and (H) Heatmaps of the quantified splicing profiles of 5ʹ or 3ʹ AS events.
(F) and (I) Heatmaps of the quantified splicing profiles of IR events and CS intron changes.

