Figure 6.
RRC1 and SFPS Coordinately Regulate Pre-mRNA Splicing of a Subset of Genes.
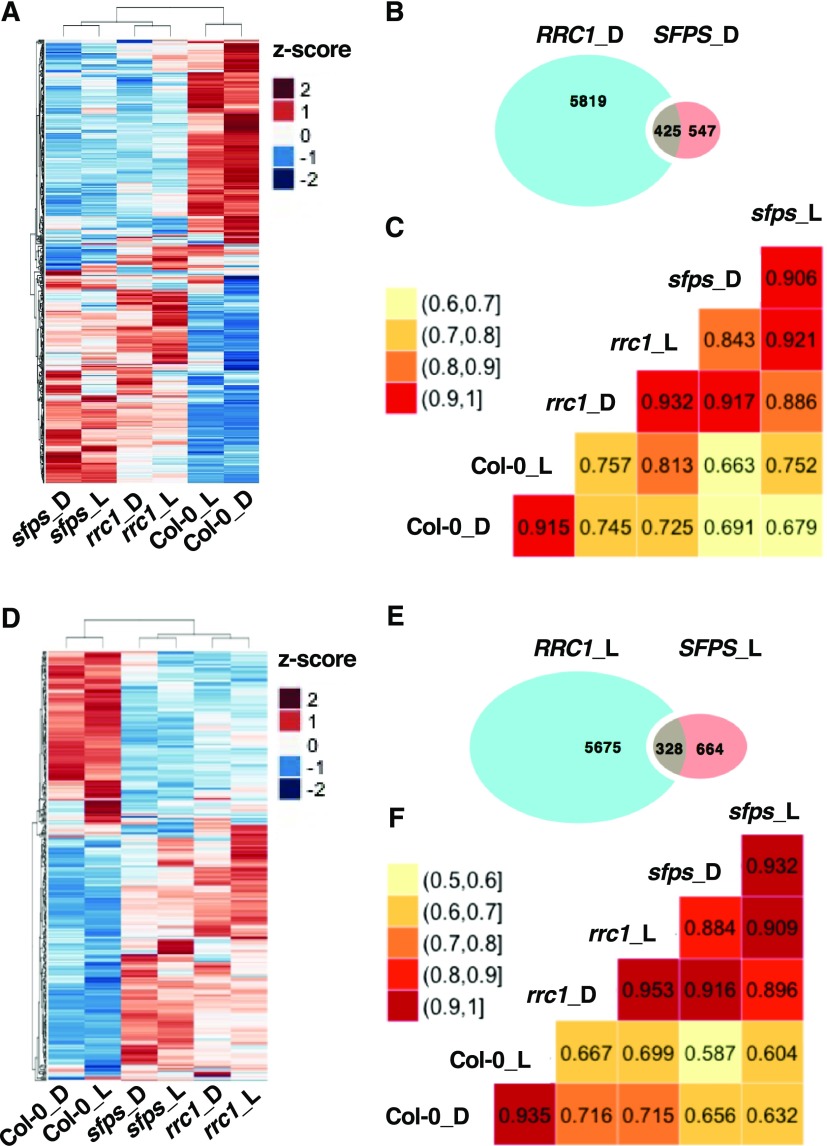
(A) and (D) Heatmaps of splicing efficiency of the differential spliced events that are coregulated by SFPS and RRC1, based on Z-scores of PSI/PIR values in the dark (A) and light (D) samples. Hierarchical clustering was performed on the differential spliced events that are coregulated by SFPS and RRC1. Blue color represents low Z-scores, whereas red color represents high Z-scores. Red light intensity used was at 7 μmol m−2 s−1.
(B) and (E) Venn graphs show the overlap of the splicing changes in sfps-2 and rrc1-3 mutant backgrounds compared with the wild type under dark (B) and light (E) conditions. In total, 425 and 328 overlapped targets were discovered under dark (B) and light (E) conditions, respectively.
(C) and (F) The correlogram to visualize the correlation of samples, based on the splicing efficiency (PSI/PIR) of the events that are coregulated by SFPS and RRC1 in dark (C) and light (F) conditions. The correlation coefficient of each pair of samples is labeled in the matrix plots.

