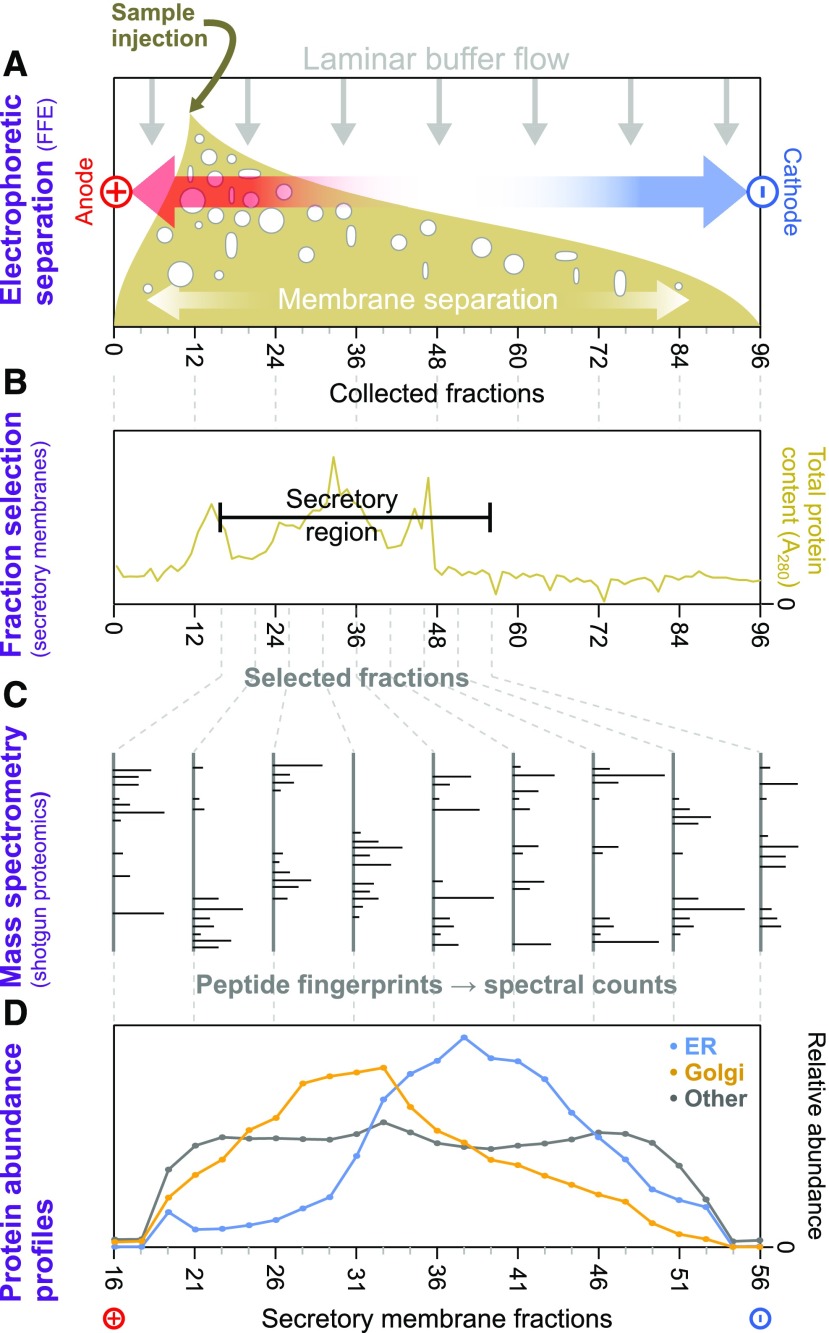
Figure 1.
Schematic Overview of Electrophoretic Separation Profile Analysis of Endomembrane Proteins.
(A) Samples from Arabidopsis cell-suspension cultures, enriched in intact endomembranes, were separated by voltage under laminar flow (i.e., using FFE). This provided gentle separation of membrane-bound compartments, according to their surface charges, and resulted in 96 separately collected fractions, ordered along the voltage axis.
(B) Total protein content of FFE fractions was determined via absorption at 280 nm to identify the range of fractions with major endomembrane protein enrichment. These and adjacent fractions were then taken forward for more detailed analysis. Nonmembrane components from the samples peaked in early fractions outside this range.
(C) Endomembrane fractions were primarily investigated using shotgun proteomics to measure the relative amounts of the different proteins contained therein. Here, proteins were identified via the mass fingerprints of trypic digest peptides searched against the most recent Arabidopsis proteome using MASCOT software.
(D) Average FFE abundance profiles for resident proteins from Golgi, ER, and other organelles using independent subcellular localizations derived from LOPIT analysis (Supplemental Data Set 1). Protein abundance values from multiple replicate FFE runs, in the form of spectral intensities, were combined (see Methods for the fraction-matching procedure), generating 25 merged, consensus endomembrane fractions. Combined data are shown for totals of 200 ER, 204 Golgi, and 1290 other organelle proteins.

