Figure 2.
Primary Determination of Organelle Subproteomes.
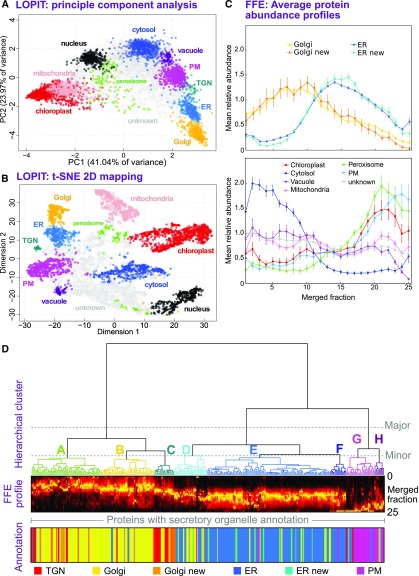
(A) PCA analysis of a single LOPIT experiment. Protein abundance profiles from density-based separation are presented by projection onto their two principal, orthogonal axes, representing most interprotein variance. Each point represents a single protein, which is colored according to its organelle classification. Organelle clusters were distinguished using multiple-class SVM on complete abundance profiles and used existing annotations for classification (see Methods).
(B) Presentation of the same LOPIT data and classifications shown in (A), presented as a 2D t-SNE plot. This visualization attempts to preserve the proximity of similar profiles, and the separation of distinct profiles, over all data dimensions (whole profiles). This is unlike PCA, which shows (dis)similarity along the selected projection axes.
(C) Average FFE profiles, across 25 merged fractions from replicates R3 to R5, are shown for organelle groups classified using LOPIT data. Plotted values represent the mean abundance for each fraction in each organelle class from per-protein normalized profiles (see Methods). Error bars represent the se. Data are shown separately for the ER and Golgi (upper plot), which peak as a class in central fractions, and the distinct profiles for other organelles/compartments (lower plot). ER and Golgi proteomes have been subdivided as either those belonging to the initial organelle markers or those newly classified as organelle residents, demonstrating the accuracy with which new residents were assigned.
(D) Hierarchical clustering of secretory (ER, Golgi, TGN, and PM) protein FFE profiles. Merged abundance profiles from proteins identified in high-quality replicates R3 to R5 were clustered using Ward’s method and presented as a dendrogram with the corresponding, underlying abundance profiles shown beneath as a color density plot, together with primary organelle classifications derived from LOPIT. The three major clusters that separated profiles generally into Golgi/TGN, ER, and PM were further separated into eight smaller clusters, labeled A to H. Here, a threshold was chosen so that each major ER and Golgi cluster contained three minor clusters.

