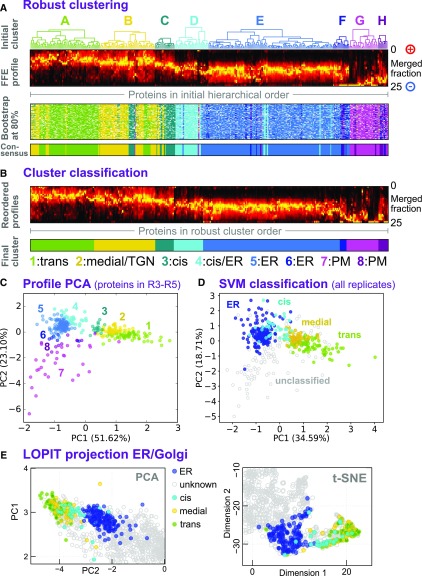
Figure 4.
Classification of Sub-Golgi Compartments.
(A) Robust clustering of secretory protein FFE profiles via bootstrapping. Abundance profiles (second from top) were reclustered using Ward’s method 120 times, each time omitting 20% of the proteins. The resulting clusters were assigned to the corresponding initial clusters A to H (see Figure 2) by similarity to the cluster medioids. These clusters are shown as a color map (third panel), where each row corresponds to a different, random subset of proteins, and is presented in the initial hierarchical cluster column order (as used in Figure 2). The robust, consensus clusters (lower panel) were defined as the most common cluster identity for each protein over all the bootstrap trials.
(B) FFE profiles for each of the eight consensus groups were separately reclustered (Ward’s method) to clearly visualize profile characteristics of each group. The groups were relabeled 1 to 8 to discriminate them from the initial clusters A to H, which have (slightly) different memberships. These were then used for tentative assignment of particular groups (1–4) to sub-Golgi compartments using trends presented in Figure 3. Abundance profiles are presented as a color density map, as in (A), but in a new intragroup order.
(C) Merged FFE profile data, for proteins present in replicates R3 to R5, plotted as a 2D PCA projection and labeled according to the bootstrap consensus clusters 1 to 8, as illustrated in (B).
(D) Merged FFE profile data, for all secretory proteins detected in any of the replicates R1 to R5, presented as a 2D PCA projection. Multiple-class SVM was used to classify proteins (on whole FFE profiles, not the 2D map) into three sub-Golgi groups and an ER group. The group labels used in the classification came from LOPIT to provide distinction between resident ER and Golgi proteins (and to exclude TGN ones), given that profiles overlap, to a degree, in the FFE data but not in the LOPIT data. The consensus FFE subclusters (as in [C]) were then used to classify the three sub-Golgi groups from among the larger Golgi proteome. Consensus subclusters and final proteomes are detailed in Supplemental Data Set 3.
(E) Re-presentation of a section of the LOPIT PCA map shown in Figure 2A, now colored according to ER and sub-Golgi classes presented in (D).
(F) Re-presentation of a section of the 2D t-SNE map shown in Figure 2B, now colored according to ER and sub-Golgi classes presented in (D).

