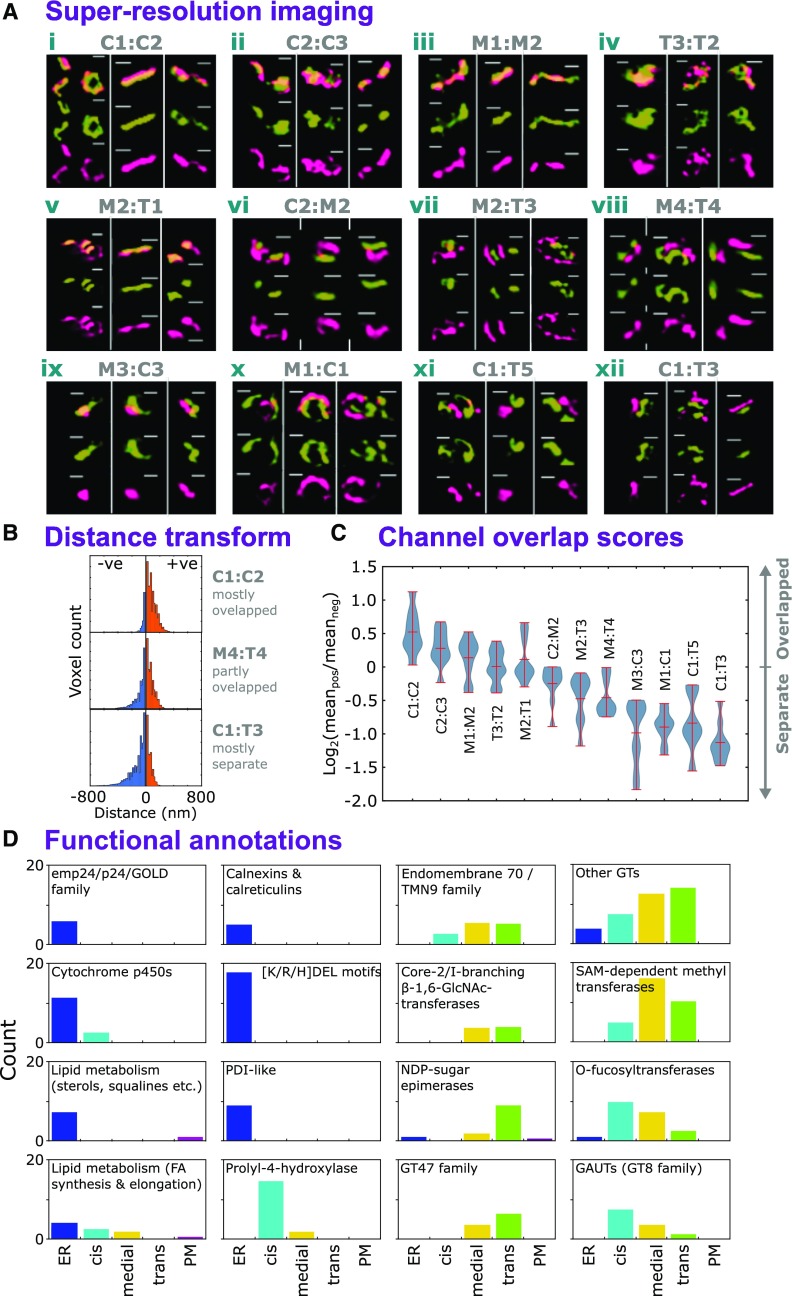
Figure 5.
Validation of Sub-Golgi Protein Localization.
(A) Example images of SIM of validatory protein pairs representative of cis- (C), medial- (M), and trans- (T) Golgi sublocalizations. Sub-Golgi locations of PUBQ10-driven, C-terminally tagged GFP and RFP fusion proteins (Grefen et al., 2010) were assayed to provide pairwise comparisons by using transient expression in N. benthamiana. For each protein pair, localization data were collected from nine regions (Supplemental Data Set 4), incorporating three image stacks from at least two leaves per plant. Localizations were visualized in a single Golgi body from each of the three image stacks. The gene identifiers for the proteins were as follows: AT2G20810.1 (C1), AT5G47780.1 (C2), AT2G43080.1 (C3), AT1G26850.1 (M1), AT3G62720.1 (M2), AT5G18480.1 (M3), AT1G19360.1 (M4), AT1G74380.1 (T1), AT1G08660.1 (T2), AT4G36890.1 (T4), AT2G35100.1 (T3), and AT5G11730.1 (T5). Bars = 400 nm.
(B) Three example histograms showing the distribution of distance transform values for image regions containing multiple Golgi stacks with spatially overlapping (top), partly overlapping (middle), and somewhat separate (bottom) labeled protein pairs (i.e., from red/green fluorescence microscopy illustrated in [A]). Channel signal overlap was quantified by thresholding intensities to generate ROIs, then summing the distance transform values for one channel’s ROIs within the ROI bounds of the other. Here, negative values indicate greater separation and positive values indicate overlap.
(C) The distribution of red/green channel overlap scores, over multiple image regions (n = 9), for the validatory protein pairs shown in (A), arranged in modal order. Overlap scores were calculated for each image region as the log2 ratio of mean absolute values on either side of zero distance (see blue and orange regions in [B]), with positive values indicating more overlap. Image regions are given in Supplemental Data Set 4.
(D) Occurrence of protein families and functional annotation in the secretory and sub-Golgi proteomes. Using ER, TGN, and PM localizations derived from LOPIT data and sub-Golgi localizations from FFE (Supplemental Data Set 3), proteins were grouped variously according to family, MapMan (Ramsak et al., 2014) functional categorization, and possession of the K/H/RDEL ER-retrieval motif. Groups with at least five members are presented here.

