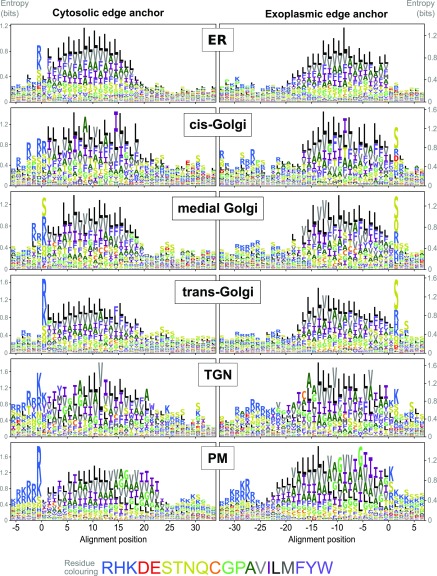
Figure 7.
TM Amino Acid Composition in Sub-Golgi and Secretory Compartments.
Logo plots of single-span TM proteins from secretory and sub-Golgi proteomes indicating the relative abundance of amino acids at and around aligned TM spans. Data are shown for the Arabidopsis proteins localized by LOPIT and FFE and their very close homologues. Different sequences were aligned at either the cytoplasmic (left column) or exoplasmic/luminal (right column) edge of the hydrophobic TM spans. (See Methods for details of gathering homologues and aligning TM sequences.) The different amino acids are color-coded according to their physiochemical properties, as indicated in the color key (bottom). Logo plots were generated after randomly sampling 1000 sequences for each data set from position-specific residue abundance probabilities calculated from dissimilarity weighted sequences. This was done to reduce the bias caused by the different sizes of protein families (i.e., which are informatically somewhat redundant).

