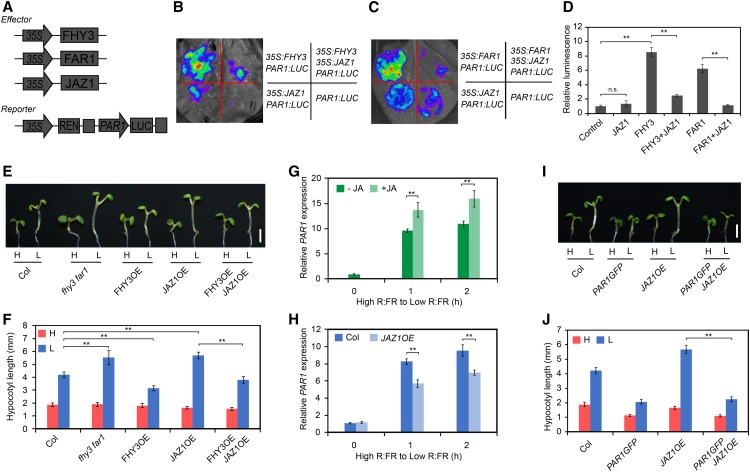
Figure 5.
JAZ1 Represses the Transcriptional Activity of FHY3 and FAR1.
(A) Schematic diagram of the PAR1 promoter-driven dual-LUC reporter and effector constructs.
(B) and (C) Transient expression assay in N. benthamiana leaves. Representative images of N. benthamiana leaves 72 h after infiltration are shown.
(D) Quantification of the transient expression assay. The relative LUC activities normalized to the REN activity are shown (LUC/REN). Significant differences are indicated: **, P < 0.01, Student’s t test; n.s., no significance. Values are means ± sd, n = 3.
(E) and (F) Hypocotyl length of wild-type, fhy3-11 far1-4, FHY3OE, JAZ1OE, and FHY3OE JAZ1OE seedlings grown under simulated shade conditions. Representative images of seedlings are shown in (E). Bar = 2 mm. Quantification of hypocotyl length is shown in (F). **, P < 0.01, Student’s t test. Data are means ± sd, n > 15.
(G) qRT-PCR analysis of PAR1 expression in wild-type seedlings treated with JA. Five-day-old seedlings were grown in high R/FR (0 h) and then transferred to low R/FR supplemented with 50 μM JA for 1 and 2 h. **, P < 0.01, Student’s t test. Data are means ± sd, n = 3.
(H) qRT-PCR analysis of PAR1 expression in wild-type and JAZ1OE plants. Five-day-old seedlings were grown in high R/FR (0 h) and then exposed to low R/FR for the indicated times. **, P < 0.01, Student’s t test. Data are means ± sd, n = 3.
(I) and (J) Hypocotyl length of wild-type, PAR1-GFP, JAZ1OE, and PAR1-GFP JAZ1OE seedlings grown under high and low R/FR ratios. Representative images of seedlings are shown in (I). Bar = 2 mm. Quantification of hypocotyl length is shown in (J). **, P < 0.01, Student’s t test. Data are means ± sd, n > 15.

