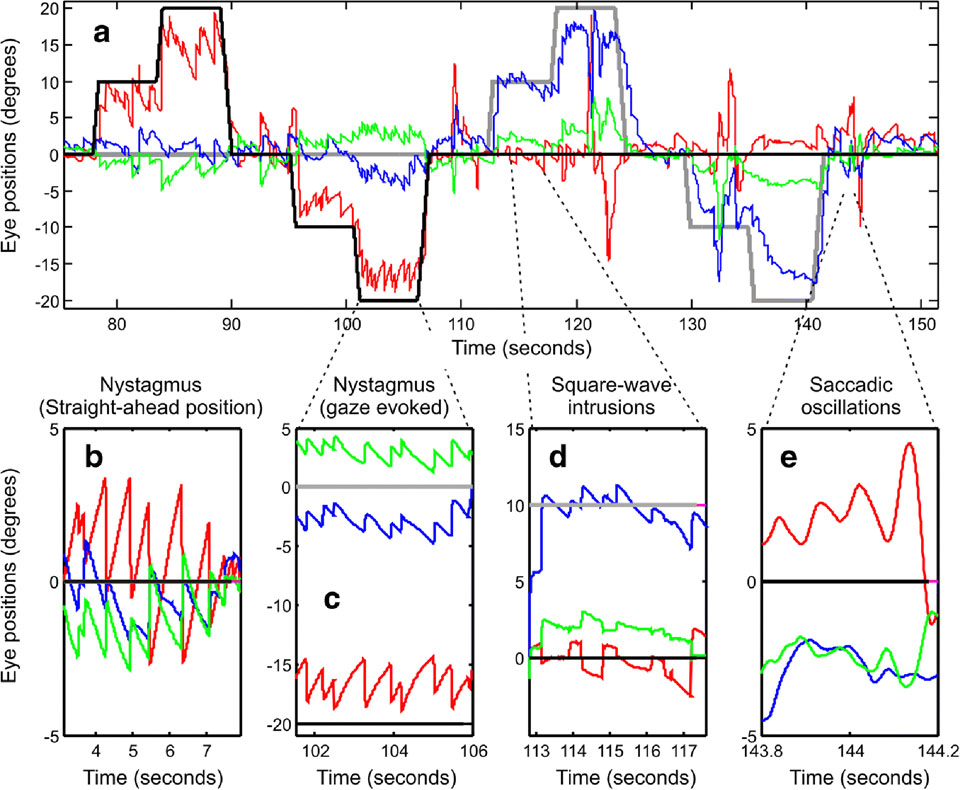
Fig 3.
An example of a gaze fixation in one ataxia-telangiectasia patient. (A) Horizontal, vertical, and torsional eye positions (y-axis) are plotted versus time (x-axis). Horizontal eye positions are plotted in red color, blue trace is vertical eye position, and torsional is green. Black dashed line represents the horizontal target position and the grey dashed line is the vertical target position. Positive values correspond right-ward, up-ward, and clock-wise rotations from the subjects’ viewpoint. The detailed qualitative inspection of the eye movement waveform is depicted in panels ‘B-E’. Arrows in panels ‘D’ and ‘E’ illustrate square-wave saccadic intrusions and saccadic oscillations, respectively (reproduced with permission from Shaikh, et al., 2009).

