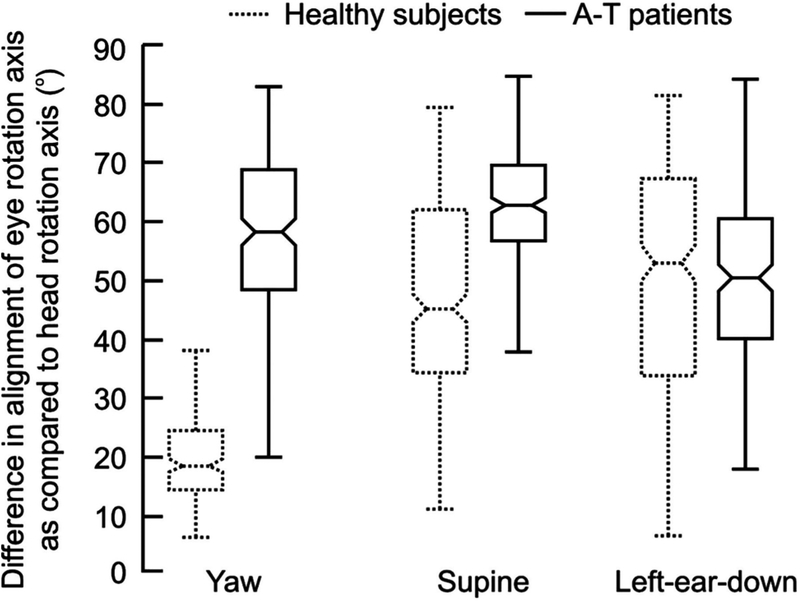
Fig 6.
Summary of differences in the angular orientation of the eye movement and head movement axes. The difference in rotation axes is plotted on y-axis. Each box and whisker plot shows one condition in a given group of 13 ataxia-telangiectasia patients (solid box) and 11 normal subjects (dashed box). A-T: ataxia telangiectasia (reproduced with permission from Shaikh, et al., 2011).

