Figure 1.
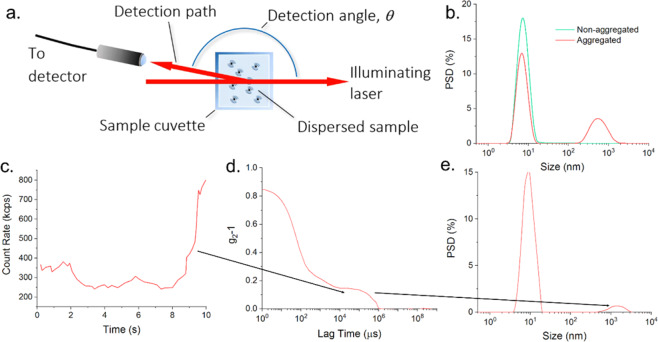
(a) Schematic of a typical DLS instrument, configured to detect backscattered light from the dispersed sample. (b) Replicate time averaged particle size distributions for a protein sample, showing the intermittent appearance of a large size component which also coincides with a perturbation to the position of the primary peak. (c–e) Analysis process of a DLS measurement- Light scattering intensity (c) showing a spike in the signal due to the appearance of an aggregate at t > 8 s, which can which can degrade the measured correlation function (g2-1) (d) and the accuracy of the intensity weighted particle size distribution (e).

