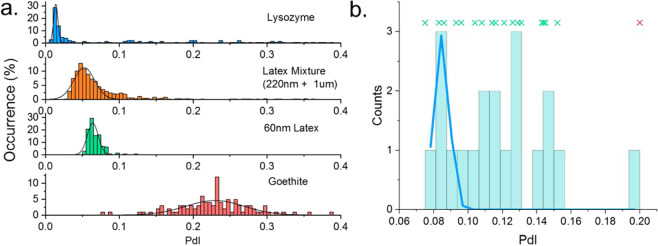
Figure 3.
(a) Distributions of PdI for a range of aggregated/contaminated samples, demonstrating the need for a sample specific definition to identify the measurement of transient particles. These distributions also show that the PdI is a biased distribution, and as such, a three standard-deviations from the mean threshold for outliers would not be robust. (b) Histogram of a sparsely collected set of measurements for a sample of lysozyme. Whilst fitting using a least squares regression and a Gaussian model in (a) reliably allowed the statistics of sufficiently sampled data sets to be determined, an attempt to fit to a sparse data set is shown in blue but shows poor correlation with the distribution data due to apparent under sampling. Also shown is a scatter plot of the individual values showing their spread. The individual point show in red is successfully identified as an outlier by the Rosner generalised many outlier procedure.

