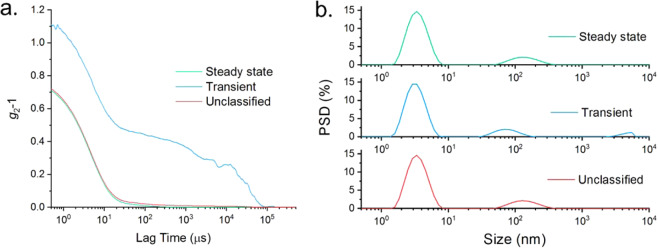
Figure 6.
(a) Autocorrelation functions for the steady state, transient and unclassified data for a measurement of 5 mg/mL dispersion of lysozyme. The unclassified and steady state data appear closely comparable, but analysis of the transient data gives insight to the presence of trace large particles. (b) Intensity weighted particle size distributions for an aggregated sample of 5 mg/mL lysozyme, calculated independently for the steady state, transient and unclassified data sets. In all instances, a monomer and aggregate peak are observed at 3.8 and ~100 nm, however the transient data also shows an additional large size peak.

