Fig. 1.
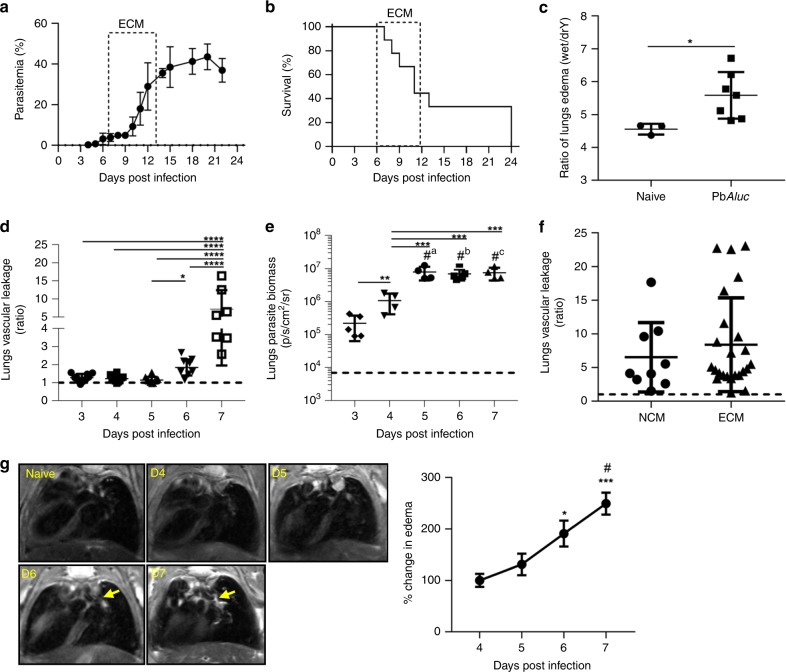
Pathophysiological parameters measured in the lungs during PbAluc-infection in C57BL/6 mice. a Peripheral parasitemia levels and b survival curve of PbAluc-infected mice (n = 9). The boxed area indicates the experimental cerebral malaria (ECM) phase. c Ratio of lung edema (wet-to-dry weight ratio) at 7 days post infection (dpi) in infected (n = 7) and naive C57BL/6 (n = 3) mice. d Ratio of in vivo lung vascular leakage measured by Tracer-653 dye at 3–7 dpi (n = 10). e Ex vivo quantification of parasite biomass in the lungs based on luciferase activity of luciferase-tagged parasite after perfusion at 3 (n = 5) 4 (n = 4), 5 (n = 4), 6 (n = 5) and 7 dpi (n = 4). The data shown are representative of two independent experiments. f Ratio of in vivo lung vascular leakage assessed in mice with non-cerebral malaria (NCM) (n = 9) and with experimental cerebral malaria (ECM) (n = 24). The black dashed line at y = 1 in (d–f) represents the ratio of the tracer reading from naive C57BL/6 mice (n = 3). g MRI images of naïve C57BL/6 (n = 4) and PbAluc-infected mice (n = 5) taken consecutively from 4–7 dpi. Yellow arrows show edema (left hand side images). Edema quantification based on manual segmentation/volume calculation (right hand side graph). The data represent the mean ± SD; *p < 0.05 by Mann–Whitney test (c); *p < 0.05, **p < 0.01, ***p < 0.001, ****p < 0.0001 by ANOVA with Bonferroni’s post-test (d–e, g). Figure e, “#” represents statistical significance compared to 3 dpi; a,b,cp < 0.0001; Figure g, represents statistical significance compared to 4 dpi (p < 0.05); “#” represents statistical significance compared to 5 dpi (***p < 0.001)

