Fig. 2.
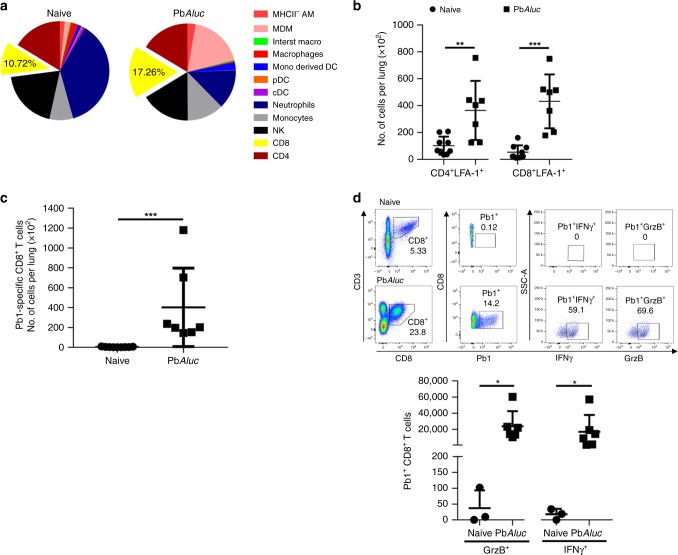
Inflammatory response induced in the lungs during PbAluc-infection in C57BL/6 mice. a Relative percentage of the mean counts of each immune-cell population found in the lungs of naive (n = 9) and PbAluc-infected mice (n = 11) at 7 dpi derived from the total number of cells shown in Supplementary Fig. 1. MHCII- AM MHC-Class II negative alveolar macrophages, MDM monocyte-derived macrophages, DC dendritic cell, cDC conventional dendritic cell, pDC plasmacytoid DC, NK natural killer. b Total number of CD4+LFA-1+ and CD8+LFA-1+ T cells and c Pb1-specific CD8+T cells accumulated in the lungs of naive (n = 9) and infected mice (n = 7). d Tetramer and intracellular cytokine staining was performed on lungs sequestered leukocytes from naive (n = 3) and PbAluc-infected mice (n = 6). Cells were incubated with Brefeldin for 3 h without re-stimulation. The indicated dot plot (top) was used to analyze the Pb1-specific CD8+T cells and to gate the IFN-γ+ and GrzB+ population. The total number of Pb1-specific CD8+T cells secreting each cytokine is represented graphically (bottom). The data shown are representative of two independent experiments. The data represent the mean ± SD; *p < 0.05, **p < 0.01, ***p < 0.001 by Mann–Whitney test (b–d)

