Fig. 1.
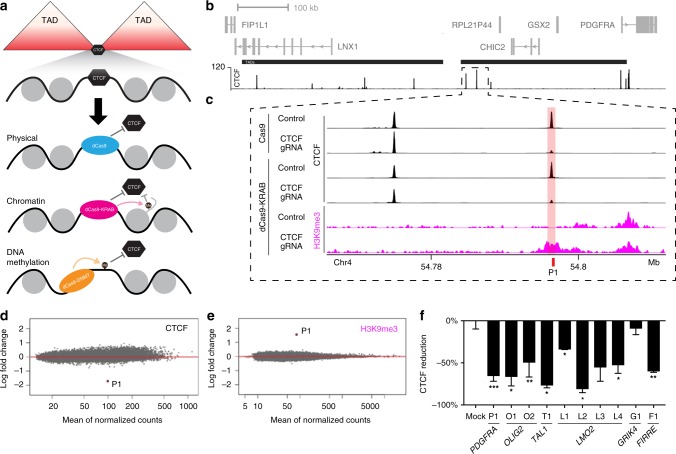
Epigenome editors can specifically disrupt CTCF binding at topological insulators. a Schematic depicts potential epigenome editing strategies for displacing CTCF from a theoretical insulator separating two TADs. b Genomic view of the PDGFRA locus on chromosome 4 shows genes (gray), two TADs (black bars, middle) and CTCF ChIP-seq signal for HEK293 cells (black, bottom). c Expanded view of the boundary region flanking the TAD that contains the PDGFRA promoter shows ChIP-seq signals for CTCF (black) and H3K9me3 (pink). CTCF profiles are shown for HEK293 cells after epigenome editing by Cas9 or dCas9-KRAB, with gRNA to the PDGFRA insulator P1 CTCF target site (pink shade) or a non-targeting control. H3K9me3 profiles are shown for HEK293 cells after epigenome editing by dCas9-KRAB, with gRNA to the PDGFRA insulator P1 CTCF target site or a non-targeting control. d, e Plots show differential ChIP-seq signals for CTCF (d) or H3K9me3 (e) over all CTCF peaks genome-wide, in cells expressing dCas9-KRAB with P1 targeting gRNA (relative to control). Each point represents the log fold change in normalized read counts observed at that locus, ordered by the mean count observed across all conditions. CTCF occupancy is reduced and H3K9me3 is increased specifically over the targeted P1 CTCF site. f Bar plots show change in CTCF occupancy measured by ChIP-qPCR over indicated CTCF sites following transient transfection with dCas9-KRAB and indicated gRNA (see also Fig S1). CTCF disruption by epigenome editing is robust across the ten individually targeted loci. Data are normalized to non-targeting controls. Error bars, mean ± s.e.m. *P < 0.05, **P < 0.01, ***P < 0.001 by Student’s t-test. n = 4 (P1 and O1) or 2 (other loci) biological replicates, respectively. Source data for 1f are provided as a Source Data file, ChIP-seq and RNA-seq data can be found via GEO accession GSE121998

