Fig. 2.
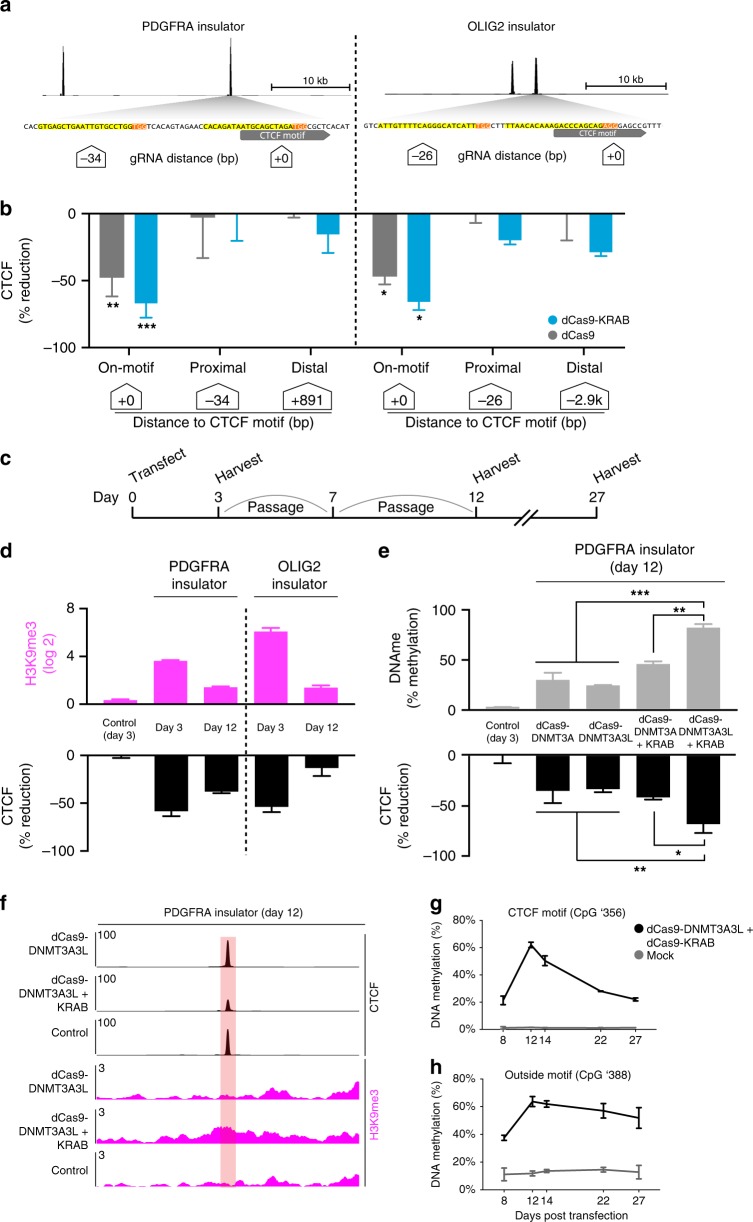
Locus-specific DNA methylation confers stable CTCF disruption. a Schematic depicts CTCF sites in the PDGFRA and OLIG2 insulators. CTCF ChIP-seq signal is shown for HEK293 cells (top, black). Expanded view below shows underlying DNA sequence. gRNAs were designed to directly target the CTCF motifs or proximal sequence. CTCF motifs (gray), gRNA PAMs (orange) and gRNA spacers (yellow) are highlighted. White boxes indicate distance of each gRNA to CTCF motif. b Bar plots show change in CTCF occupancy at the PDGFRA (left) or OLIG2 (right) insulators in HEK293 cells transfected with indicated epigenome editing construct and gRNA, as measured by ChIP-qPCR. Only gRNAs targeted directly to the CTCF motif significantly reduced CTCF binding. White boxes indicate distance of each gRNA to CTCF motif. Error bars, mean ± s.e.m. n ≥ 3. *P < 0.05, **P < 0.01, ***P < 0.001 by Student’s t-test. (See also Fig S2). c Schematic depicts the experimental time course in panels d–g. Cells were transiently transfected with epigenome editing reagents plus either a single targeting gRNA or a non-targeting control, and passaged as indicated until expression of the construct was no longer detectable (see also Fig. S2F). d Bar plots show change in H3K9me3 (top, pink) or CTCF occupancy (bottom, black) measured by ChIP-qPCR at the PDGFRA or OLIG2 insulators at days 3 and 12 post transfection with dCas9-KRAB plus single targeting gRNAs or a non-targeting control. CTCF occupancy normalized to mock transfected controls. Error bars, mean ± s.e.m. n ≥ 2. e Bar plots show change in DNA methylation measured by methylation sensitive restriction followed by qPCR (top/gray), and change in CTCF occupancy measured by ChIP-qPCR (bottom, black), at the P1 CTCF site in the PDGFRA insulator at 12 days post transfection with the indicated combination of epigenome editing reagents. CTCF reduction normalized to mock transfected controls. Data analyzed by two-way ANOVA. Error bars are mean ± s.e.m. n ≥ 2. f ChIP-seq tracks for CTCF (black) and H3K9me3 (pink) at the P1 insulator site at 12 days post transfection with the indicated epigenome editing reagents, plus a single gRNA targeted to the P1 site or a non-targeting control. g–h Plots show changes in DNA methylation of two CpGs in the PDGFRA P1 site following transient transfection with dCas9-DNMT3A3L + dCas9-KRAB plus a single gRNA targeted upstream of the CTCF motif (See also Supplementary Table 1). Cells were harvested at the days indicated (x-axis). DNA methylation was assessed by bisulfite sequencing. Error bars are mean ± s.e.m. n = 2. Insulator methylation is maintained in dividing cells after initiation by transient epigenome editing reagents. Source data for 2b, 2d, 2e, 2g are provided as a Source Data file. ChIP-seq and RNA-seq data can be found via GEO accession GSE121998

