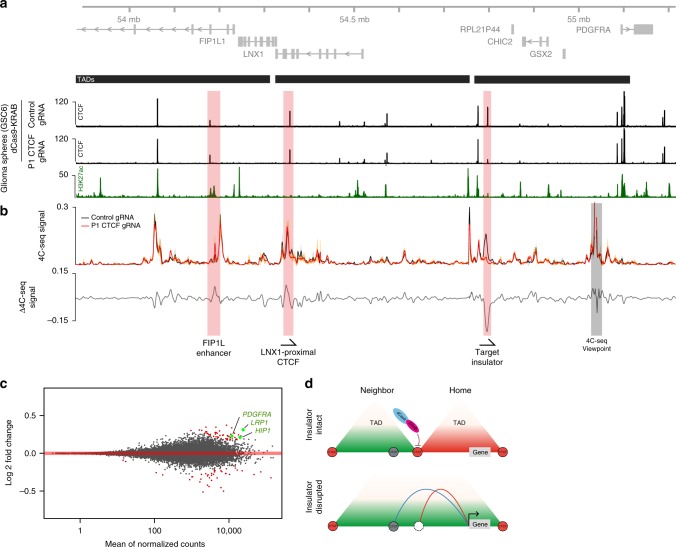
Fig. 3.
Dissecting topological mechanisms of gene control with epigenome editors. a Genomic view of the expanded PDGFRA locus on chromosome 4 shows genes in gray (top). The region shown is divided into three TADs (black bars, middle), per HiC data. ChIP-seq signal tracks for CTCF (black) are shown for GSC6 cells following transfection with dCas9-KRAB plus single gRNA targeting the P1 CTCF site or non-targeting control. ChIP-seq for H3K27ac (a marker of regulatory activity) in GSC6 is shown green. b Plot shows 4C-seq signal measured from a viewpoint near the PDGFRA promoter. GSC6 cells were transfected with gRNA targeting the P1 CTCF site (red) or non-targeting control (black), as in a. Signal is shown as the mean across replicates (solid line) ± one standard deviation (shaded area around mean). The difference in 4C-seq signal between the two conditions is shown below the 4C-seq signal (gray line, bottom). Epigenome editing of the P1 site with dCas9-KRAB decreases interactions between the PDGFRA promoter and the CTCF insulator, and modestly increases interactions between the PDGFRA promoter and sites in the adjacent TAD, including the LNX1 proximal CTCF site, and the previously described FIP1L1-proximal enhancer. c Plot shows differential gene expression measured by RNA-seq from GSC6 cells following epigenome editing with dCas9-KRAB and single gRNA targeted to the P1 site or a non-targeting control. Differentially expressed genes (P< 0.05) are highlighted (red). Differential PDGFR pathway genes are indicated (green). d Schematic depicts consequences of insulator disruption by epigenome editing. In glioma cells, insulator disruption at the PDGFRA locus increases interactions across the disrupted insulator, which may allow enhancers to contact sites in the neighboring TAD. Data are available via GEO accession GSE121998

