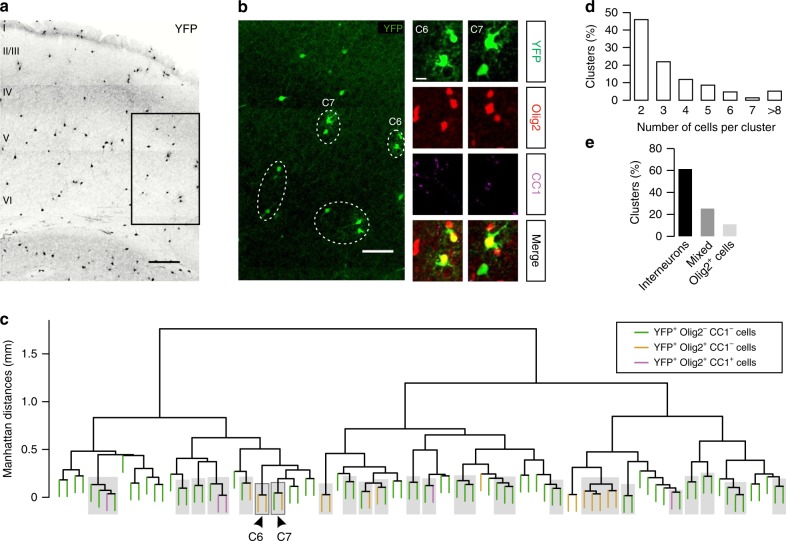
Fig. 2.
Dbx1-derived interneurons and OPCs form cell clusters at PN10. a Confocal image of a coronal section of the somatosensory cortex from a PN10 Dbx1CRE;Rosa26YFP mouse showing YFP+ cells. Scale bar: 200 µm. b Magnification of the rectangle in a showing the unsupervised clusters of YFP+ cells detected by hierarchical cluster analysis in this region (dotted ellipses). Insets: two identified clusters containing OPCs and detected with an approximately unbiased p-value ≥ 0.95. They are indicated by arrowheads in the dendrogram in c. Note that C6 is formed by two YFP+/Olig2+/CC1−OPCs and C7 by a YFP+ interneuron (negative for both Olig2 and CC1) and a YFP+/Olig2+/CC1−OPC, showing the co-existence of different cell clusters. Mature YFP+/Olig2+/CC1+ OLs are rarely observed at this age. Scale bars: 80 and 10 µm. c Hierarchical clustering dendrogram displaying the relationship between Dbx1-derived interneurons (green), OPCs (yellow) and OLs (magenta) according to their Manhattan distances in the same slice. Detected YFP+ cell clusters with approximately unbiased p values ≥ 95% are shown in gray boxes while isolated cells are outside these boxes (72 ± 3% cells in clusters vs. 28 ± 3% isolated cells; n = 11 slices from 4 mice, p < 0.0001, Mann–Whitney U test). d, e Percentages of clusters according to the number of cells per cluster (d) and the cell composition (e)

