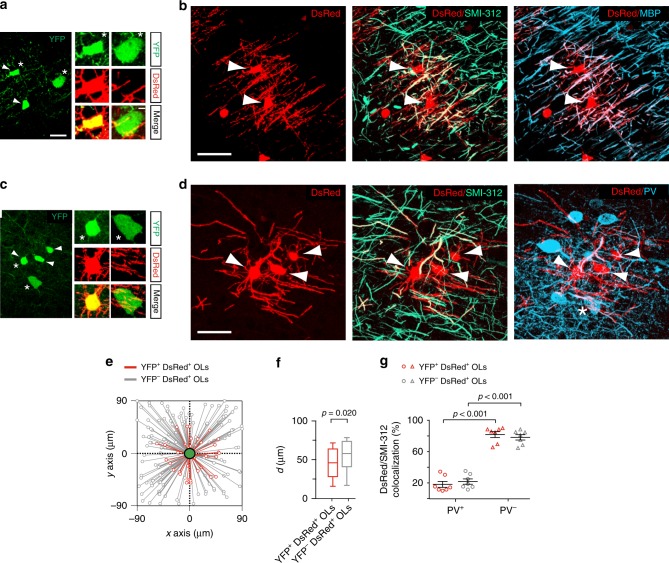
Fig. 4.
Dbx1-derived OLs myelinate axons of PV+ and PV− neurons in cell clusters. a, c Confocal images of two YFP+ cell clusters composed of YFP+/DsRed+ OLs (white arrowheads) and YFP+ interneurons at PN19 in the somatosensory cortex of Dbx1CRE;Rosa26YFP;PLPDsRed mice. Insets: magnification of a YFP+/DsRed+ OL and a YFP+ interneuron of the same clusters (asterisks). Scale bars: 25 and 5 µm. b The DsRed+ branches of OLs belonging to the cluster in a (top, white arrowheads) co-localize with the axonal marker SMI-312 (middle) and MBP (bottom), confirming that these cells are myelinating cells (n = 24 firstOLs from n = 3 mice). d The DsRed+ branches of OLs belonging to the cluster in c (top, white arrowheads) co-localize with the axonal marker SMI-312 (middle) and PV, the specific marker of FSI (bottom), confirming that some branches myelinate PV+ interneurons. The asterisk indicates the soma of the PV+/YFP+ interneuron in the cluster (mean area occupied by YFP+/DsRed+ OL: 13419 ± 698 µm2; mean diameter: 155.57 ± 7.88 µm; n = 9 from 9 clusters). Scale bars in b and d: 50 µm. e Spatial distribution of YFP+/DsRed+ OLs (red) and YFP−/DsRed+ OLs (gray) with respect to YFP+ interneurons (green) in YFP+ cell clusters (n = 22 clusters). Note the shorter intersomatic distances for OLs and interneurons from the Dbx1 lineage, but the lack of a specific orientation of OLs. f Box plots of distances (d) of YFP+/DsRed+ OLs (red) and YFP−/DsRed+ OLs (gray) to YFP+ interneurons (mean intersomatic distance: 44.2 ± 3.5 µm for n = 33 YFP+/DsRed+ OLs compared to 53.5 ± 2.1 µm for n = 99 YFP−/DsRed+ OLs, respectively, in 22 clusters; Mann–Whitney U test; significant p-value is indicated). Boxes show interquartile ranges and medians; whiskers indicate 10% and 90% percentile values. g Dot plots of percentages of PV+ and PV− axons co-localizing with SMI-312 and DsRed+ branches of YFP+/DsRed+ OLs (red; n = 7 clusters from 3 mice) and YFP−/DsRed+ OLs (gray; n = 7 clusters from 3 mice) (two-way ANOVA, F = 0.978 and DF = 1; significant p-values are indicated). Data in g are presented as mean ± SEM

