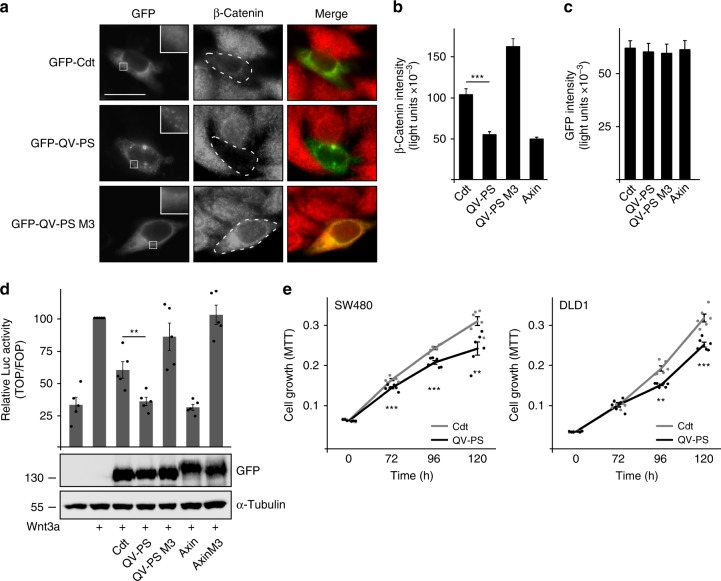
Fig. 4.
Loss of RGS aggregation increases inhibition of Wnt/β-catenin signaling by conductin. a Immunofluorescence staining of endogenous β-catenin (red) in SW480 cells transfected with indicated GFP-tagged constructs (green). In GFP panels, insets are shown enlarged at the upper right. Dashed lines mark transfected cells. Scale bar: 20 µm. b Quantification of β-catenin fluorescence intensities in one out of five representative experiments as in a. Results are mean ± SEM (n = 50). c Quantification of GFP intensities in cells analyzed in b. Results are mean ± SEM (n = 50). Data distribution is shown in Supplementary Fig. 7. d Upper panel: Luciferase activity (TOP/FOP) in HEK293T cells transfected with indicated plasmids without or with (+) Wnt3a treatment. Results are mean ± SEM (n = 5). Lower panel: Western blotting for GFP in extracts of HEK293T cells which were transfected with indicated GFP-tagged constructs at equal ratios as for the luciferase assay, and lysed directly in SDS-containing sample buffer due to differences in protein solubility. Loading control: α-tubulin. e MTT absorbance reflecting the number of viable SW480 (left panel) or DLD1 cells (right panel) expressing GFP-tagged conductin (Cdt, gray line) or the QV-PS mutant (black line) 0, 72, 96, and 120 h after seeding. One out of three representative experiments is shown. Results are mean ± SEM of six replicates (n = 6). **p < 0.01, ***p < 0.001 (Student’s t-test). Source data are provided as a Source Data file

