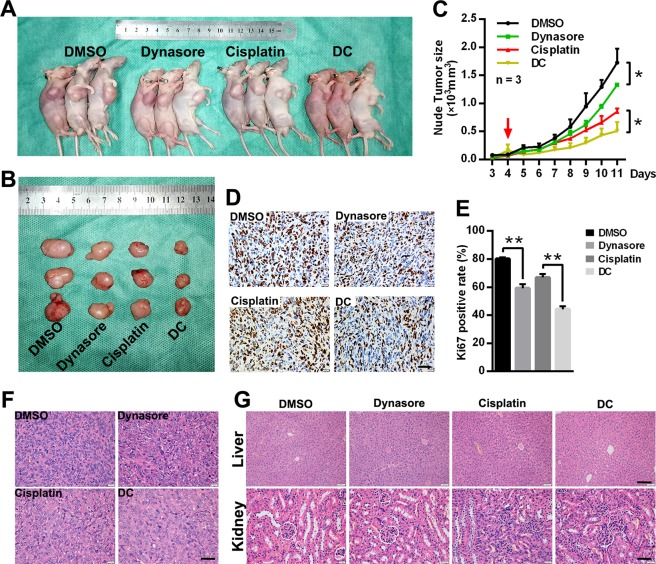
Fig. 5. Effects of dynasore and cisplatin in OS xenograft mouse model.
a, b The representative mice and tumors of the xenograft mouse modes in DMSO, dynasore (10 mg/kg), cisplatin (2 mg/kg) and combination-treated groups. c Tumor volumes were measured every day since day 3 after model establishment (day 0), and drugs administration were initiated at day 4 (red arrow). d, e Xenograft tumor tissues were subjected to IHC staining by using Ki67 antibody (Scare bar: 40 μm). Tumor samples (f) (Scare bar: 40 μm), liver (Scare bar: 100 μm) and kidney (Scare bar: 40 μm) samples (g) of four xenograft mice groups were under H&E staining. *p < 0.05 and **p < 0.01 vs. DMSO group

