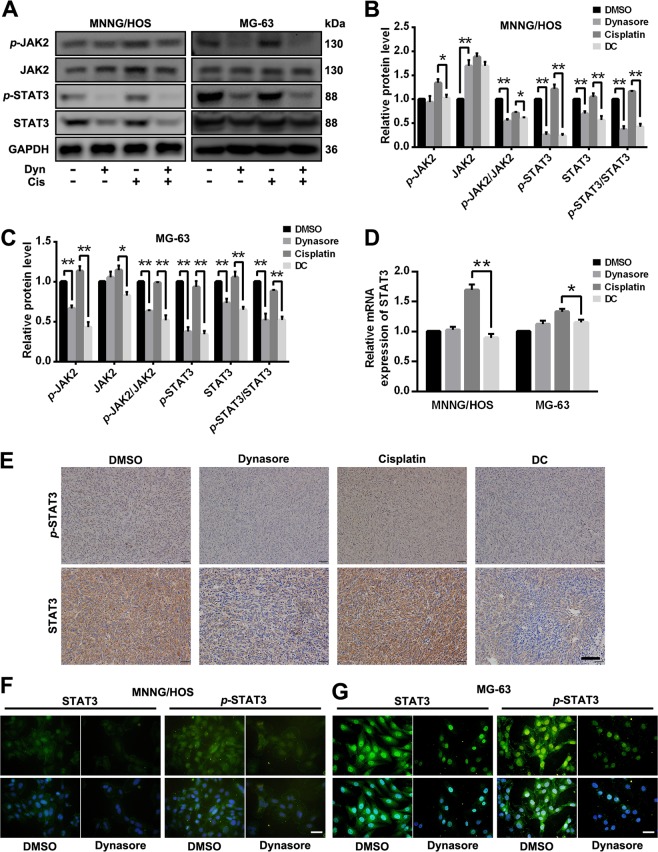
Fig. 8. Dynasore inhibit the activation of STAT3 signaling pathway.
a Western blot analysis of p-JAK2, JAK2, p-STAT3 and STAT3 of OS cells after treated with dynasore and/or cisplatin. The relative protein expression of p-JAK2, JAK2, p-STAT3, and STAT3 in MNNG/HOS (b) and MG-63 (c) were shown as histogram. d The mRNA expression of STAT3 in MNNG/HOS and MG-63 cells after dynasore and/or cisplatin exposure for 48 h. e The p-STAT3 and STAT3 expression in xenograft tumor tissues were detected by using IHC staining (Scale bar: 100 μm). The p-STAT3 and STAT3 expression were detected by using immunohistochemistry assay in MNNG/HOS (f) and MG-63 cells (g) (Scale bar: 20 μm). *p < 0.05 and **p < 0.01 vs. DMSO group

