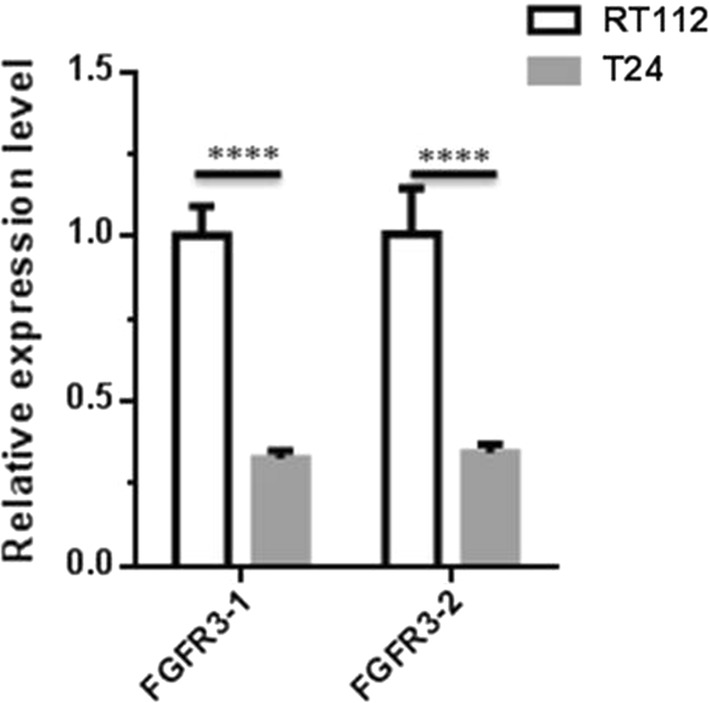
Fig. 6.

The expression level of FGFR3 in RT112 and T24 cells. The total RNA of RT112 and T24 cells was extracted, respectively. The reverse transcription was performed according to the kit protocol, and PCR was done with two pair of primers against different regions of FGFR3 according to the descriptions of “Materials and methods”. The result showed that FGFR3 both expressed in RT112 and T24 cells, but the expression level of FGFR3 in RT112 cells is threefold higher than that of in T24 cells. P < 0.0001, n = 4
