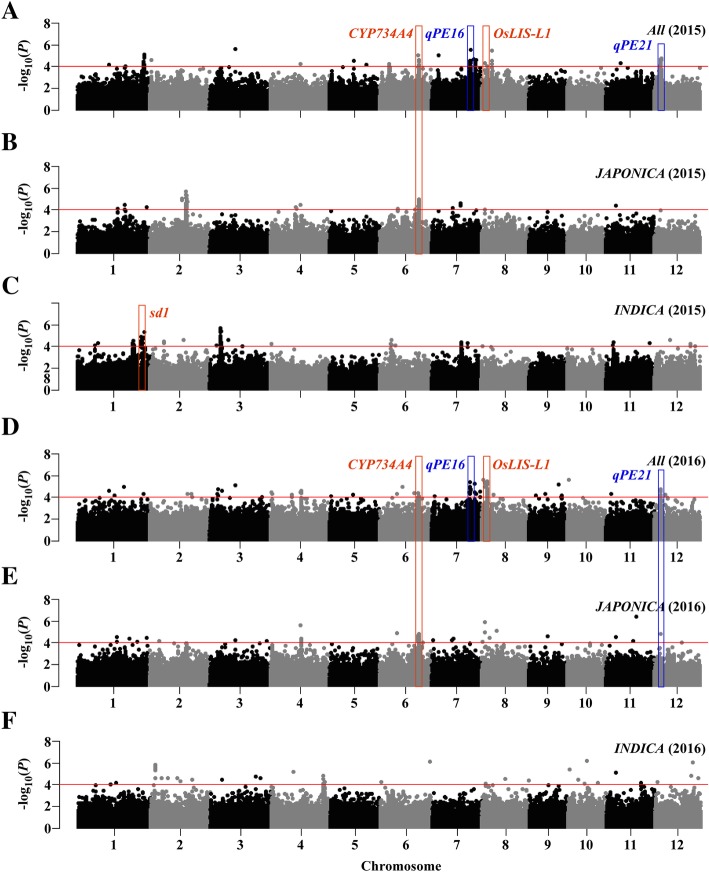
Fig. 2.
Genome-wide Manhattan plots of association mapping for PE using the EMMAX model. Associations identified based on All (2015, a; 2016, d), JAPONICA (2015, b; 2016, e) and INDICA (2015, c; 2016, f) groups are depicted in separate panels. The red bar frames indicate the genes reported previously, and the blue bar frames indicate the key novel loci co-located in both 2015 and 2016. The x axis depicts the physical location of SNPs across the 12 chromosomes of rice, and the y axis depicts -log10(P value). Significant SNPs with P ≤ 0.0001 are denoted as red lines

