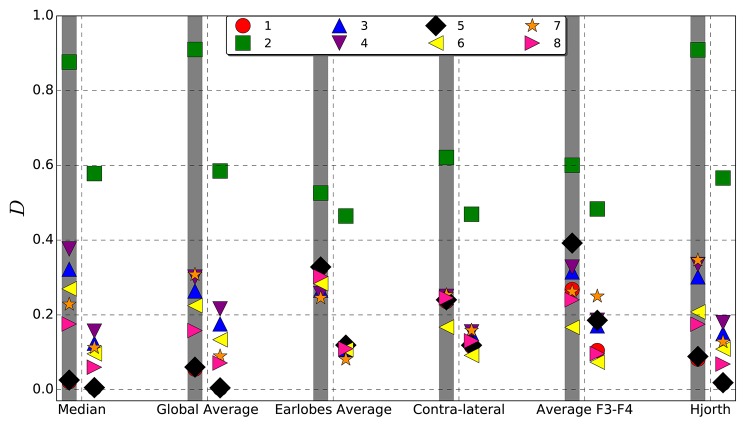
Figure 3.
Average deviation D (Equation 15) from the original, viz. untransformed interrelation pattern caused by different reference schemes estimated for synthetic data derived from each of the models listed in Table 1. Left columns, indicated by a gray shadow, show the results obtained for the correlation matrix, right columns those for the mean phase coherence matrix.

