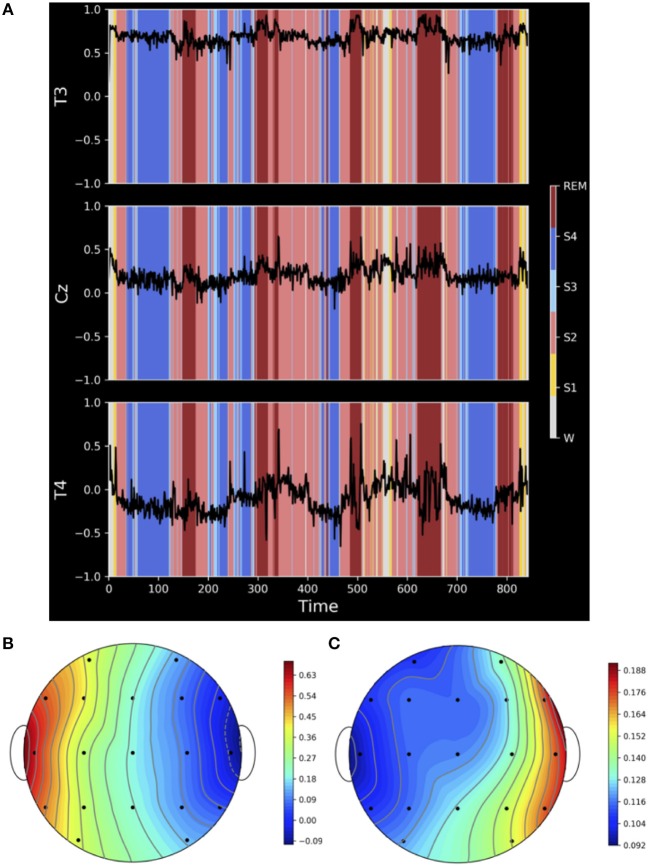
Figure 4.
(A) Correlation coefficient between the earlobe A1 and active electrodes T3, Cz and T4 estimated with a running window of length 3,840 data points (corresponding to 30 s) over the whole night recording of a clinically healthy, 26-year-old male subject. Sleep stages (W = awake, S1–S4 denotes sleep stages 1–4 and REM denotes Rapid Eye Movement sleep periods) are indicated by colored shadows in each panel. (B) Shows a heat map of the average correlation between the active electrodes and A1 and (C) the respective standard deviation. Both quantities are estimated over the whole night recording.

