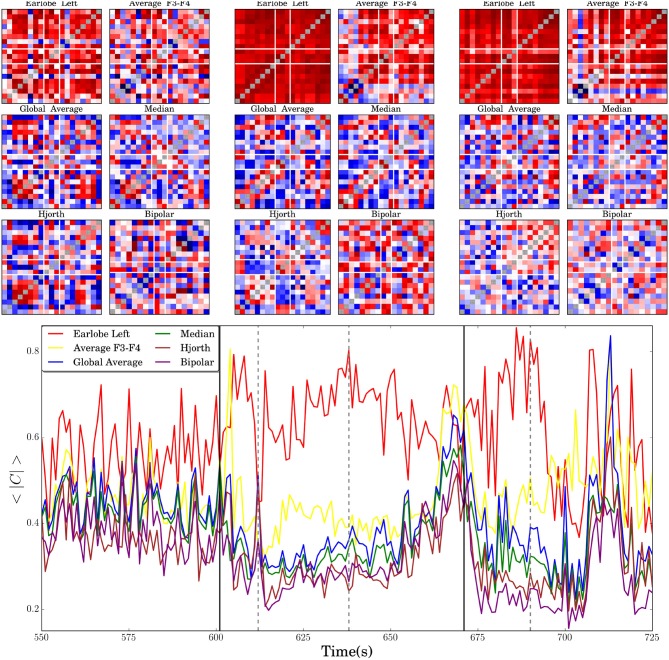
Figure 7.
In the lower panel the time evolution of the average absolute value of the non-diagonal elements of the correlation matrices 〈|C|〉, estimated for an extracranial recording of a focal onset seizure, is shown. Vertical black solid lines indicate seizure onset and offset. Dashed vertical lines mark three instances of time for which the cross-correlation matrices, obtained for different reference montages, are shown in the upper part of the figure. The first two columns of six matrices correspond to the moment just after seizure onset (around second 610), the next two columns to the instant marked in the central part of the seizure (about second 635) and the matrices of the last two columns are estimated for the marked instant of time during the post-seizure period (about second 690). In all cases the diagonal elements are artificially set to gray color in order to improve visibility.

