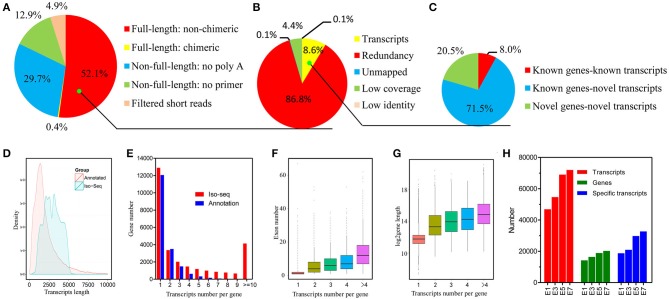
Figure 1.
Identification and characterization of chicken embryo transcripts. (A) Raw Iso-Seq reads were divided into five groups to filter FLNC reads. (B) FLNC reads were divided into five groups based on their genome mapping characteristics to filter transcripts. (C) All transcripts were divided into three groups based on their genome annotations. (D) Density plot of the length of the PacBio transcripts and previously annotated transcripts. (E) Distribution of the number of transcripts per gene generated by PacBio data and reference genome data. (F) Comparison of exon numbers among genes producing different numbers of transcripts. (G) Comparison of gene length among genes producing different numbers of transcripts. (H) Identified genes and transcripts in embryos at different developmental stages by Iso-Seq.

