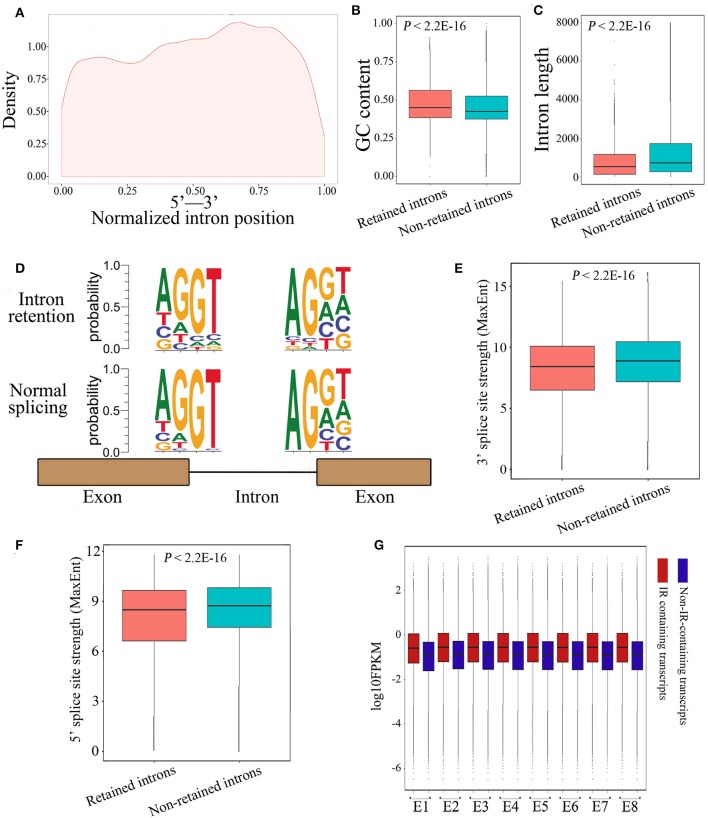
Figure 4.
Characterization of IR events in chicken embryos identified by Iso-Seq. (A) Graphic representation of the location of the retained introns within the gene body. Each location was represented as the ratio of intron start location to gene length. (B,C) Box plots representing comparison between retained introns and non-retained introns for their length (B) and GC content (C). (D) The nucleotide sequence motifs near exon-intron junctions. Four nucleotides (two exonic and two intronic) of the 5′ donor splice sites and four nucleotides of the 3′ acceptor splice sites were analyzed. (E,F) Box plots represent the comparison between retained introns and non-retained introns for their 3′ (E) and 5′ (F) splice site strength. The 3′ and 5′ splice-sites strengths of introns were calculated using MaxEnt (Yeo and Burge, 2004) with default parameters. (G) Comparison of the expression levels between IR-containing transcripts and non-IR-containing transcripts during embryonic development.

