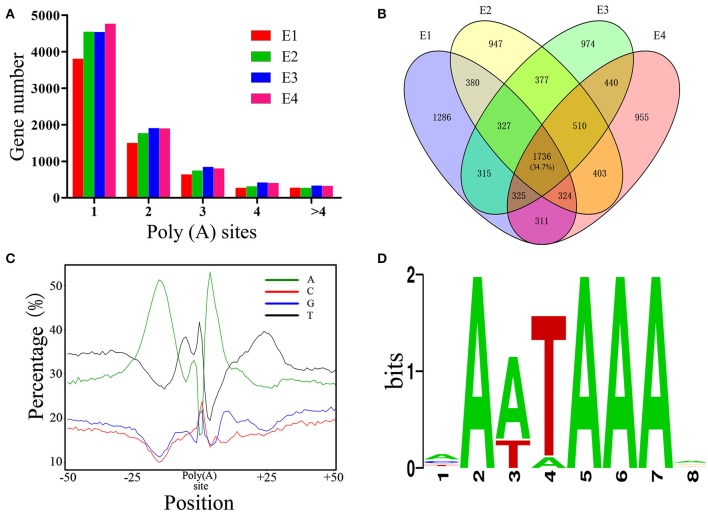
Figure 5.
Characterization of APA in chicken embryos. (A) Distribution of the number of poly(A) sites per gene generated during different stages of embryo development. (B) Venn diagram depicting the distribution of poly(A) sites among the 5,004 genes during different stages of embryo development. Each individual cell in the diagram represents the 5,004 genes, and the overlap represents the number of genes that have the same poly(A) sites. (C) Nucleotide composition around poly(A) cleavage sites. (D) The most enriched motif in the 50 bp sequence upstream of the poly(A) tail detected by MEME.

