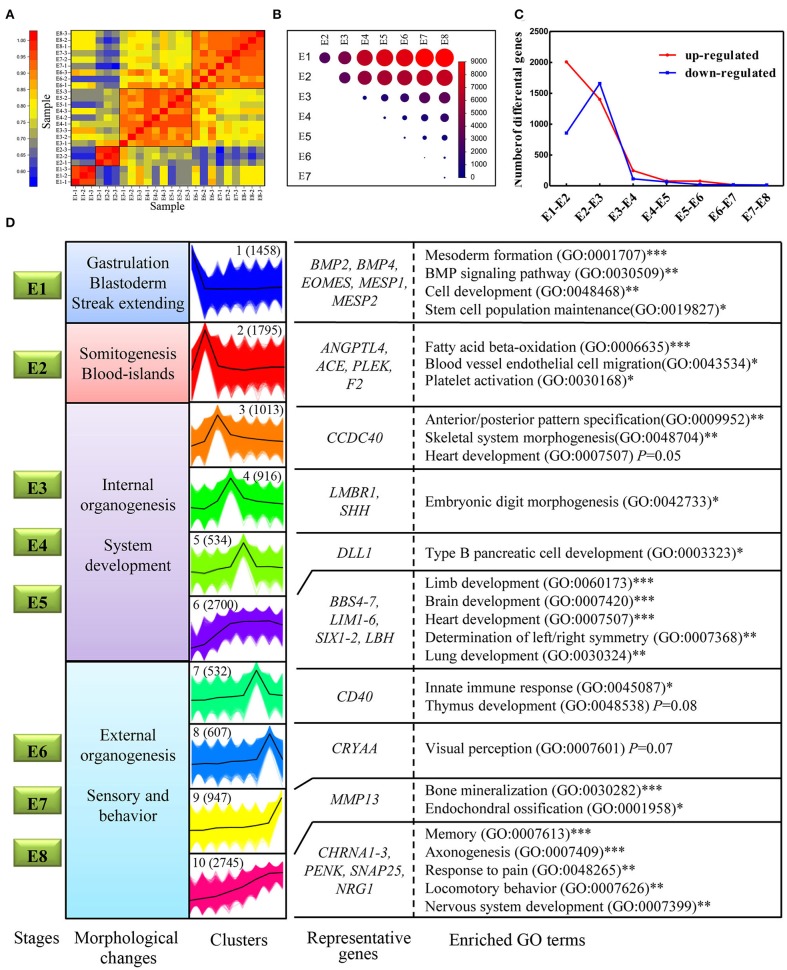
Figure 6.
Transcriptome dynamics during chicken embryo development. (A) Heatmap of Pearson's correlation coefficient between transcriptomes from the eight different embryonic stages. The four clustered stages were marked with black boxes. (B) Visualization of the number of differentially expressed genes between each pair of stages. The size of the circles represents the number of differentially expressed genes. Genes with log2fold change > 1 and FDR < 0.01 were considered as differentially expressed genes. (C) The number of significantly upregulated and downregulated genes between stage transitions. (D) All the expressed genes were clustered into 10 k-means clusters, and distinct clusters were assigned to different morphological stages according to expression patterns. Each set of clustered genes was then subjected to GO enrichment and representative GO terms and the corresponding P-values are shown. * represents a P < 0.05; ** represents a P < 0.01,*** represents a P < 0.001.

