
FIGURE 4.
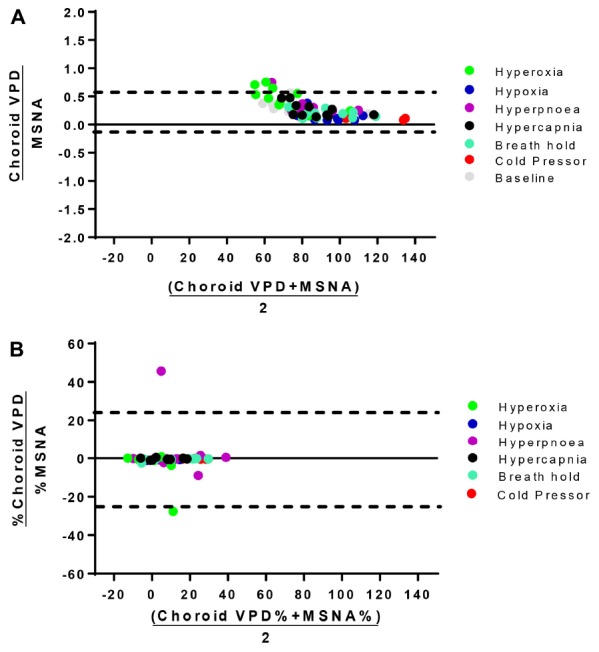
Bland-Altman analysis of choroid VPD versus MSNA. The agreement between absolute choroid vascular perfusion density (Choroid VPD) and absolute muscle sympathetic nerve activity (MSNA, A), and percentage change of choroid VPD and percentage change of MSNA (B). Bland Altman analyses are expressed as the ratio of the two measures versus the average of the two measures. Dotted lines represent the lower and upper standard deviation. Absolute choroid VPD and MSNA Bias = 0.27, SD = 0.16; Percentage change choroid VPD and MSNA Bias = −4.30, SD = 24.48. Hyperoxia (green), hypoxia (blue), hyperpnea (magenta), hypercapnia (gray), breath hold (cyan), cold pressor test (red), baseline (gray).