Figure 1.
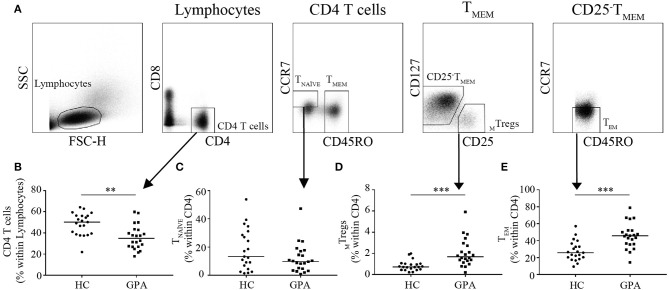
Frequencies of CD4+T cells and CD4+T cell subsets in healthy controls (HC) and GPA patients in remission (GPA). Representative FACS plots of sorted CD4+T cell subsets (A). CD4+T cell frequencies were lower in GPA than in HC (B). Within the CD4+T cell population, no differences were observed in naïve T (TNAVE) cells (CD4+CD45RO−CCR7−) (C), whereas the MTreg (CD4+CD127−CD25HighCD45RO+) frequency was higher in GPA than in HC (D). A significantly higher frequency of CD4+T effector memory (TEM) cells (CD4+CD45RO+CCR7−) was observed in GPA than in HC (E). **P = 0.01–0.001, ***P ≤ 0.001.

