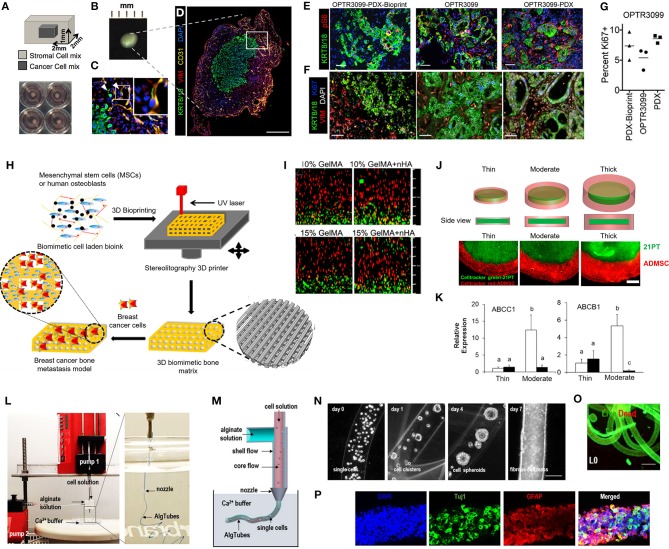
Figure 6.
Bioprinting with patient-derived materials and primary cells. (A–G) Bioprinted tissues from pancreatic patient-derived xenograft PDX-derived materials surrounding by a mixture of primary stellate cells (PSCs) and human umbilical vein endothelial cells (HUVECs) and comparison with original tissue. (A) Schematic of bioprint structure and photographs of bioprints in normal tissue culture plates. (B) Photograph of individual bioprint. (C,D) Low and high magnification of immunofluorescence (IF) images of bioprints from PDX-derived cell line after 7 days in culture, showing KRT8/18 (cancer cells) in green, vimentin (VIM, stroma) in red and CD31 (vasculature) in yellow, and DAPI (nuclei) in blue. (E) IF for KRT8/18 (green), pS6 (red), and DAPI (blue) of OPTR3099-PDX-Bioprint tissue (PSCs and HUVECs in the stromal compartment with disassociated PDX tumor tissue generated from OPTR3099 in the cancer compartment), primary patient tissue from OPTR3099, and PDX tumor tissue generated from OPTR3099 (OPTR3099-PDX). (F) Similar tissue to (E), except that IF is for KRT8/18 (green), VIM (red), Ki67 (blue), and DAPI (gray). (G) Ki67+ quantification of the percentage of Ki67+/KRT8/18+ dual positive cells shown in (F), n = 3 random fields of view, N = 1 PDX bioprint. (H,I) Bioprinted breast cancer bone metastasis model. (H) Schematic of primary mesenchymal or osteoblast cell line-laden GelMa-based 3D bioprint from stereolithography and further co-culture with breast cancer cell lines. Four groups were used, containing either 10 or 15% GelMA ± nanohydroxyapatite powder (nHA). Insert shows CAD model of the 3D matrix (gray) and 3D surface plot of the bioprinted matrix (colored image). (I) Confocal micrographs of mesenchymal stem cells (MSCs)-laden 3D bioprints 1 day post printing (cross-sectional views) for each bioprint group. Live (green) and dead (red) cells. Over 75% of cells were dead after bioprinting. (J,K) Bioprinted primary breast cancer model. (J) 21PT breast cancer line cells were first bioprinted in a photocrosslinkable gel followed by printing hydrogels of primary adipose derived MSCs (ADMSCs) around the cancer cell gel, with various thicknesses. ADMSCs in the edge region were labeled by cell tracker red, and 21PT in the middle region were labeled by cell tracker green (fluorescence images). (K) qPCR analysis of adenosine triphosphate (ATP)-binding cassette transporter gene expression of the bioprinted constructs with and without the lysyl oxidase (LOX) inhibitor, n = 3. (L–P) Glioblastoma tumor-initiating cells (TICs) culture in alginate hydrogel tubes (AlgTubes). (L) Images of extrusion system. (M) Schematic of AlgTubes production. (N) TIC growth in AlgTubes. Scale bar: 200 μm. (O) Live/dead staining of day 7 cells in AlgTubes. Scale bar: 400 μm. (P) In vitro differentiation of TICs after 10 passages. Scale bar: 100 μm. (A–P) reproduced with permission from Zhou et al. (2016), Wang et al. (2018b), Langer et al. (2019) and Li et al. (2018b), respectively.

