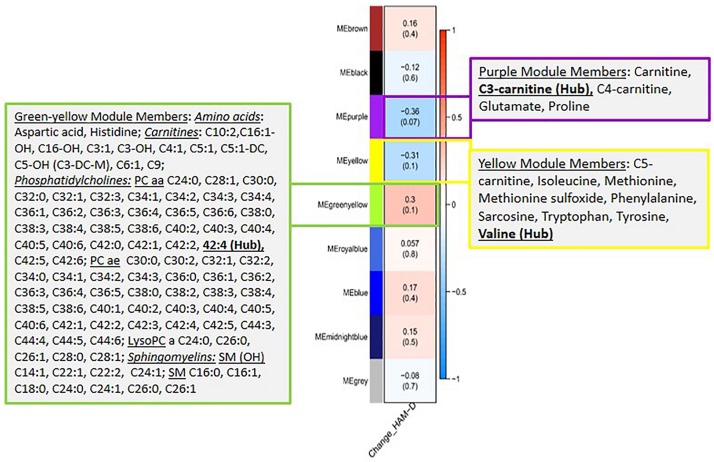
FIGURE 2.
A heatmap showing correlations between the metabolite modules and the changes in symptom severity (HAM-D17) scores. Each module represents a number of metabolites that showed strongly correlated perturbation patterns, from baseline to week 12, in response to CBT. The metabolite members of the three modules, purple, yellow and green-yellow, that showed significant association (R2 > 0.3, at p < 0.1) with changes in HAM-D17 scores are presented in adjacent boxes.

