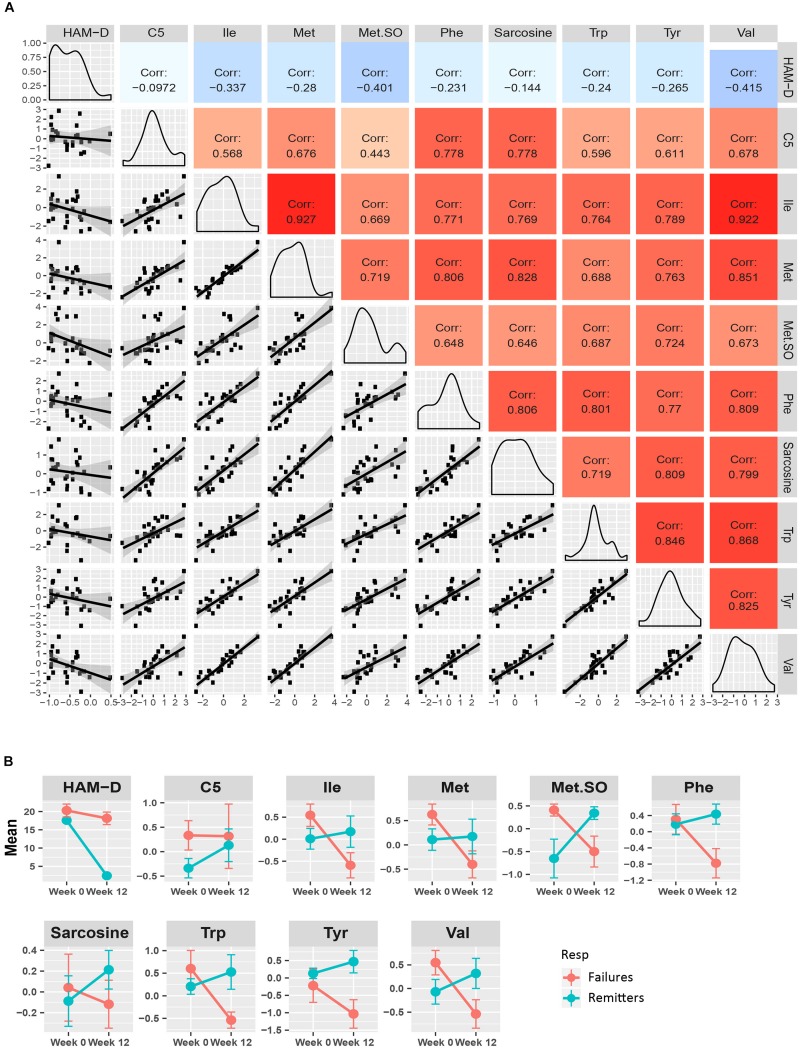
FIGURE 4.
Yellow module characteristics. (A) The pairwise correlations between the changes in the metabolite members to each other and also to HAM-D17 changes are shown in a composite plot. (B) The trajectories of each member metabolite with its mean (± SEM) at baseline and week 12 are presented for remitters and treatment-failures.

