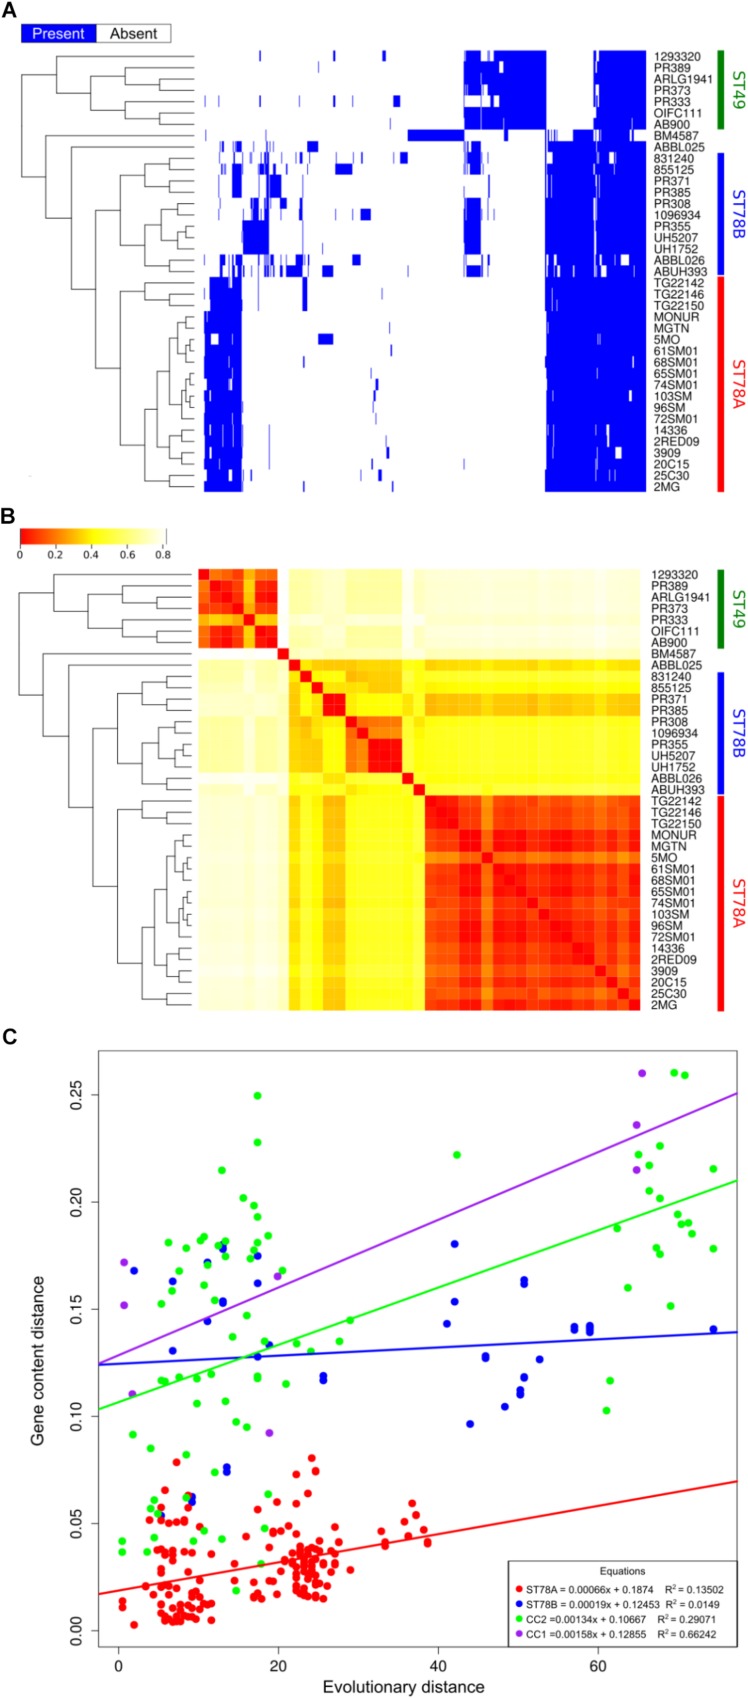
FIGURE 2.
Genome plasticity of the 39 genomes in analysis. (A) Representation of the accessory genome content (blue areas represent the presence of the gene). (B) Heatmap representing the binary distance between all genome pairs. (C) Genome plasticity of ST78A (red), ST78B (blue), International clone I (ICI, purple), and International Clone II (ICII, green) represented by comparing the evolutionary distance and the gene content distance. Each dot on the scatterplot represents a pair of genomes. Gene content distance is calculated as the binary distance from an accessory gene presence matrix. Evolutionary distance is calculated as the number of non-homoplasic SNPs between two genomes, the distance is normalized on the total number of position in the alignment used for each clade.

