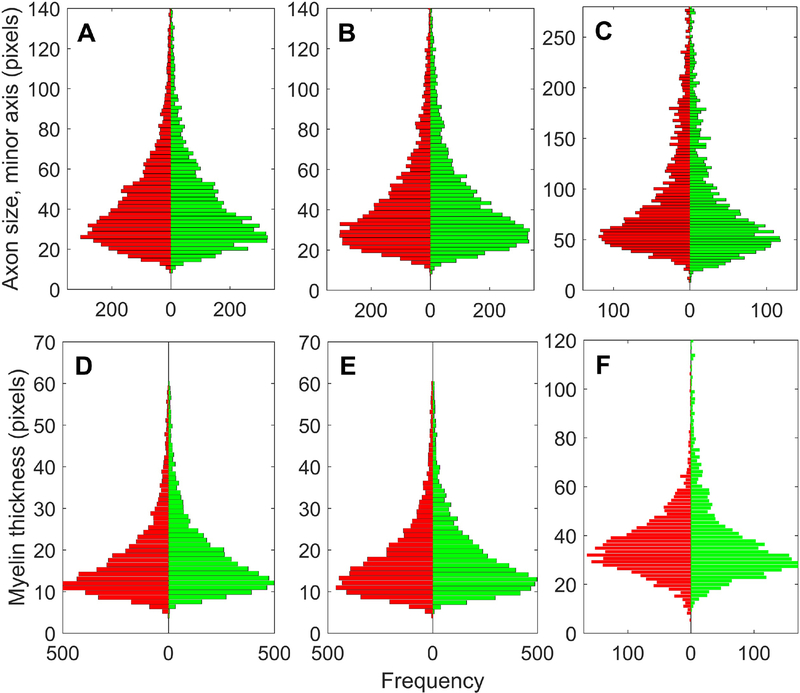
Figure 8 -.
Comparison of DNN segmented images (green) with Corrected (expert-annotated) images (red). (A) Histograms of axon sizes, in pixels, measured as the length of the minor axis of the ellipse fitted within the ROIs obtained by thresholding on pixel class Axon (ImageJ - Analyze Particles) on the first set of 30 images (WM_Set_01), each 2,048 × 2,048 pixels. Green bars give the counts from images segmented by the deep neural network DNN workflow trained on the same set WM_Set_01, while the red bars represent the same image set annotated by experts after pre-segmentation and post-processing. (B), (C) Same as (A) but on different sets of 30 images that the DNN tool has not seen before, coming from (B) the same cases sampled in the same PFWM area (WM_Set_02), and (C) optic nerve (ON_Set_01). (D),(E),(F) Histograms of myelin thickness, in pixels, as directly measured by the ray measurement (RM) tool on the same sets used for (A),(B) and (C).

