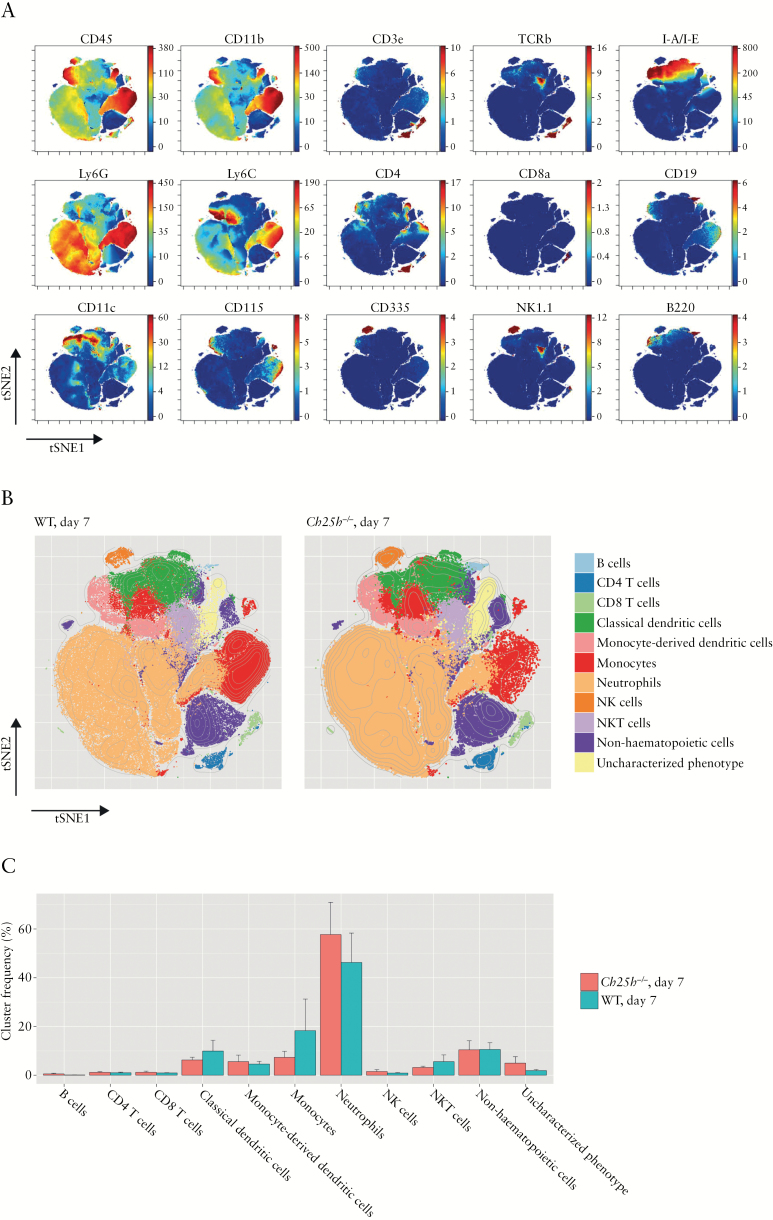
Figure 6.
Cells infiltrating the graft do not differ between wild-type and CH25H-deficient mice. Lamina propria infiltrating cells from grafts of wild-type and Ch25h-/- mice were harvested 7 days after surgery and analysed by CyTOF. [A] Dimensionality-reduced projection of the entire phenotypical landscape was calculated using the tSNE algorithm with Barnes-Hut approximation [bhSNE]. The colour coding represents staining intensity of the specified marker. [B] t-SNE maps of each experimental group; 250 000 randomly selected points are plotted. Overlaid in colour are cluster designations computed by the Phenograph clustering algorithm. The represented clusters were manually constructed by merging the initial cluster output based on phenotypical similarity until the final number of 11 identifiable clusters was reached. [C] Bar plot showing the mean cluster frequencies and error bars representing standard error of the mean [SEM] [nWT = 5, nKO = 5].

