Figure 7.
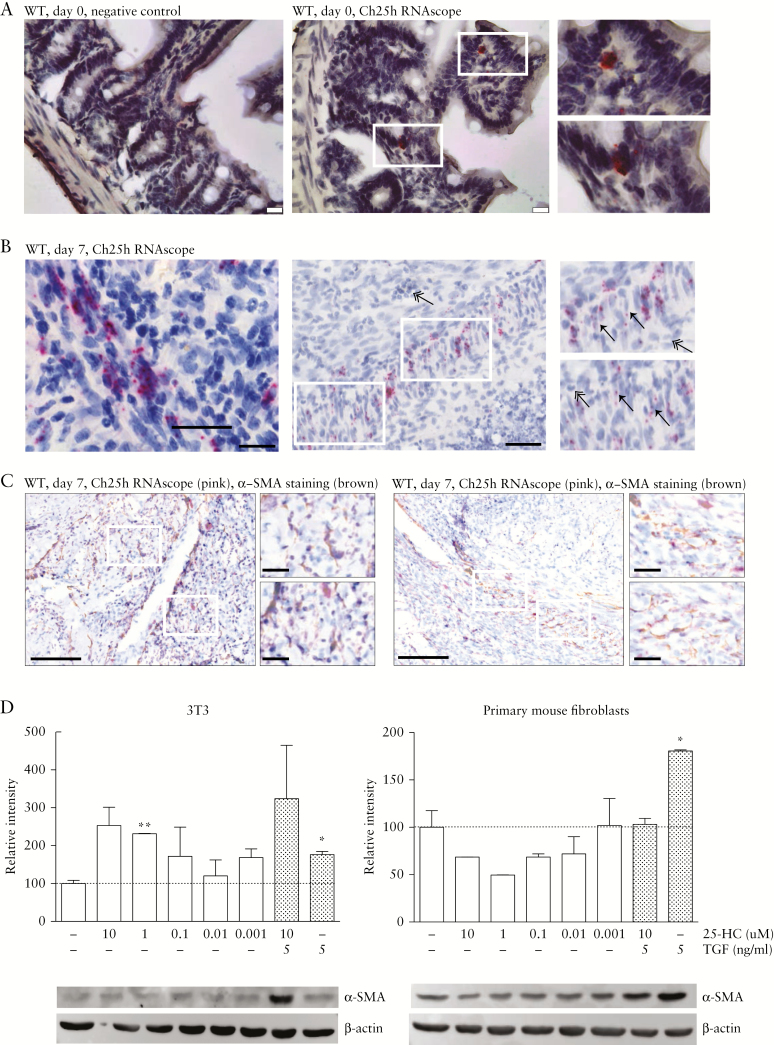
Expression of Ch25h in fibroblasts in intestinal grafts. [A] Representative images of the in situ hybridisation [RNAscope] analysis of wild-type small intestine. Negative control [a probe for the bacterial gene dihydrodipicolinate reductase, Dapb, left panel] and Ch25h mRNA [middle panel] are demonstrated with the RNAscope signal shown in red. Right panel: High resolution of inserts of the RNAscope signal. Scale bar: 25 μm. [B] Representative images of the Ch25h RNAscope analysis of the intestinal grafts of wild-type [WT] mice at Day 7 after transplantation, demonstrating accumulation of the CH25H signal in fibroblasts in the former mucosa layer. Scale bar left panel: 20 μm, middle panel: 50 μm. The right panel shows inserts of the middle panel. Fibroblasts are indicated by arrows, neutrophils by a double arrow. [C] Overlay of Ch25h RNAscope analysis and the α-SMA staining from two representative images with enlarged inserts. Scale bar: 100 μm, scale bar insert: 20 μm. [D] 3T3 cells [left panel] and primary mouse intestinal fibroblasts [right panel] were treated for 72 h with different concentrations of 25-HC and/or TGF-β as indicated. Samples were analysed for α-SMA protein levels by Western blot. Expression levels are normalised relative to the negative control and shown as mean ± standard error of the mean [SEM]. Statistical analysis: unpaired t test, the * is relative to the negative control; *p <0.05, **p <0.01, n = 2.

